
SolarAnywhere® average year summary files provide a quick summary into the solar resource, weather, and estimated losses due to snow and soiling at your site. They can be downloaded with both SolarAnywhere Typical Year, Typical Year+ and Sites licenses. These files contain long term monthly sums or averages for each of the selected irradiance or weather data fields. The years included in calculating the long-term monthly sums/averages are dependent upon the geographic data region:
| Region | Years Considered |
|---|---|
| North America, South America, Europe | 1998 – last full year at time of data version release |
| Central Asia & Africa | 2000 – last full year at time of data version release |
| East Asia & Oceania | 2006 – last full year at time of data version release |
How to Access
Average year summary datasets are currently offered through our Typical Year and Sites Licenses, with access through the SolarAnywhere online data portal or SolarAnywhere API.
Access via the SolarAnywhere Website
Average year summary files are available to download as a Data File Type from the SolarAnywhere data portal. These files are output in a custom file format designed to provide summarized insights into solar resource availability at a PV site location.
To download an average year summary file:
- Select a location for download by searching by the site location or by choosing an existing pin on the map or the location list. New sites that are added will be under the Typical Year or Typical Year+ license tier by default, however, average year summary files are also available for locations upgraded to the Sites license tier.
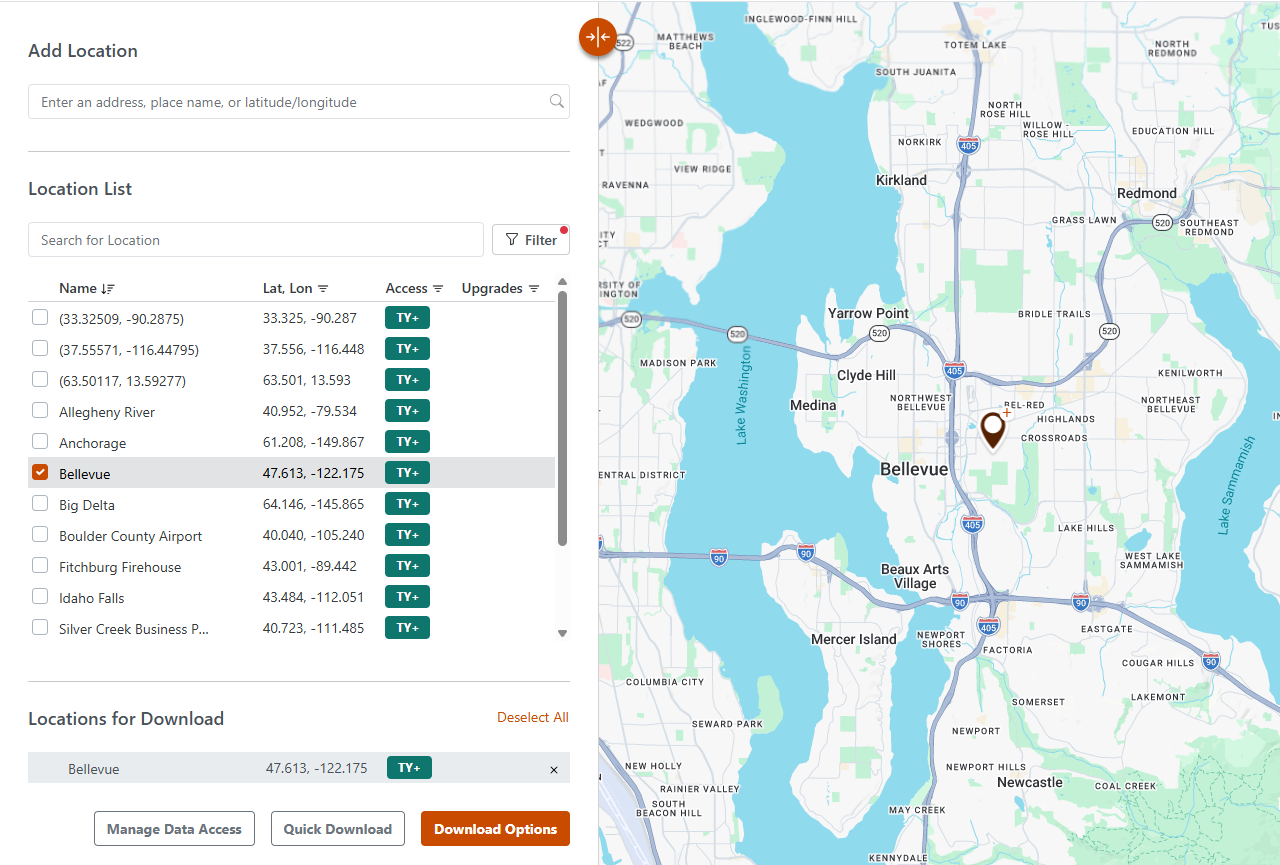
Figure 1. Selecting a Typical Year Location on the SolarAnywhere Data Website
- Click “Download Options” in the Locations for Download panel.
- Choose “Average Year Summary (AYS)” under “Data File Types”.
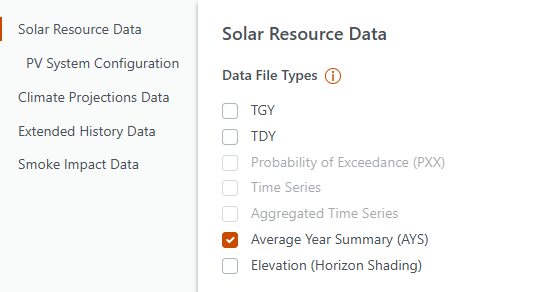
Figure 2. Selecting the Average Year Summary Option on the SolarAnywhere Data Website
- Select the preferred File Settings and Datasets, and click “Download” to generate the file.
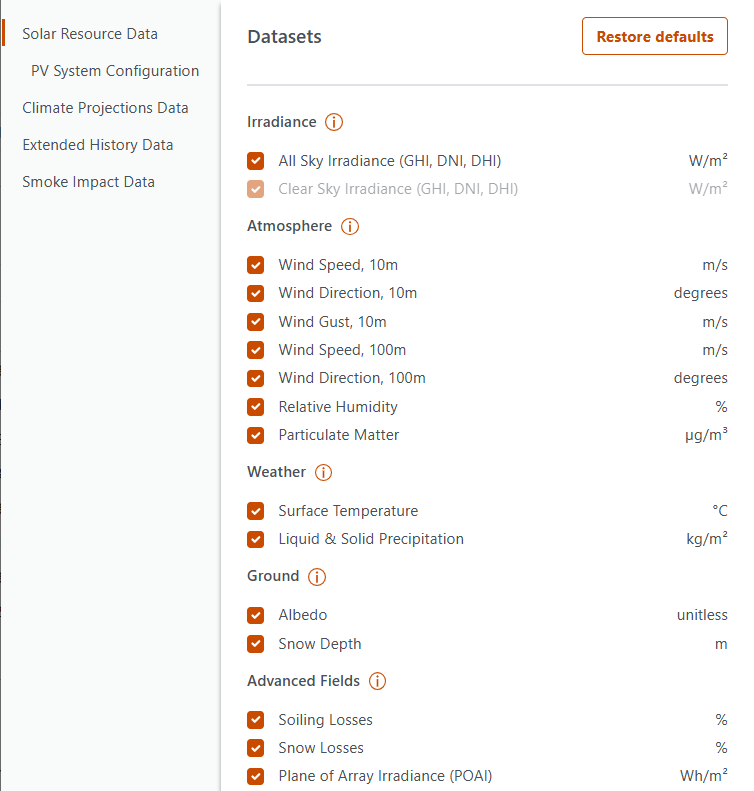
Figure 3. Selecting the Typical Year datasets on the SolarAnywhere Data Website
- Navigate to the Downloads tab to download and view the file:

Figure 4. Downloads Tab on the SolarAnywhere Data Website
Users can demo average year files with SolarAnywhere Public.
Access via the SolarAnywhere API
Average year summary data can also be requested through the SolarAnywhere API. Visit this page of our API documentation to access example average year summary requests. This process is demonstrated in the below instructional video:
How to Video: Project-specific Snow and Soiling Loss Estimates and Plane-of-Array Irradiance
Watch this short instructional video to learn how to configure a PV array within your SolarAnywhere account to obtain project-specific snow and soiling loss estimates, and plane-of-array irradiance.
Average Year Albedo
The 12-month, long-term average-albedo values provided in the average-year summary files are useful in PV performance modeling. These values are calculated from the full available time series of SolarAnywhere albedo at each location, meaning they account for long-term snow conditions.
The long-term average monthly albedos can be input directly into the project settings of your PVsyst simulations.
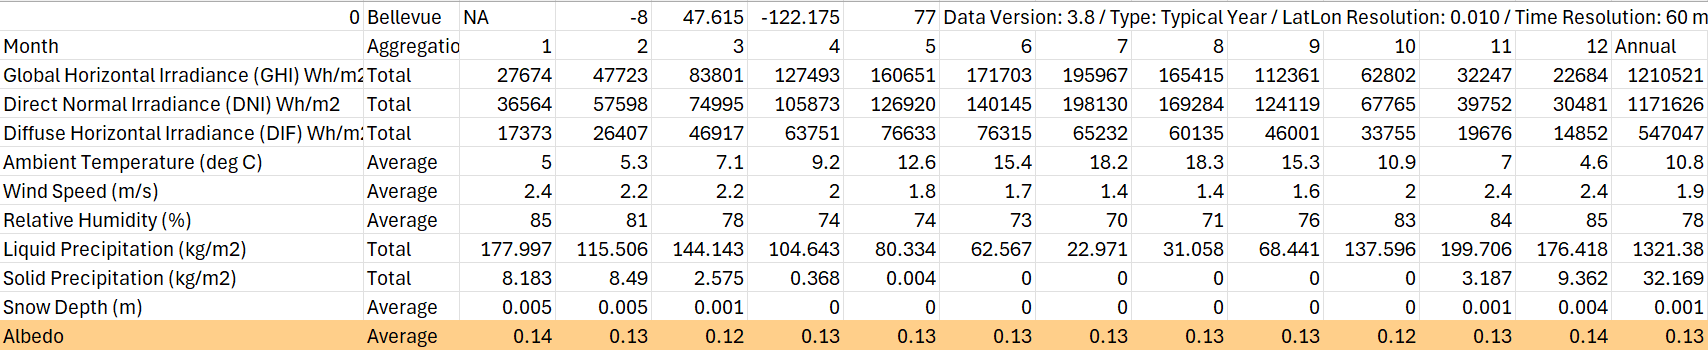
Figure 5. Example Average Year Summary file
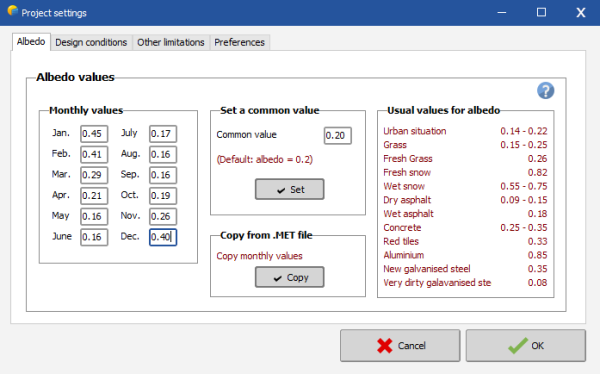
Figure 6. PVsyst project settings
Average Year Snow and Soiling Losses
The 12-month, average snow and soiling loss values provided in the average-year summary files are useful in PV performance modeling. Additionally, they may be input into third-party PV performance models such as PVsyst and PlantPredict to make PV production estimates more site-specific. Average snow and soiling loss values are calculated using open-source pvlib snow and soiling loss models with the full historical time-series SolarAnywhere weather data such as precipitation and particulate matter at the project location.
The years included in calculating the average snow and soiling loss estimates are dependent upon the geographic region:
| Region |
Years Considered for Average Snow and Soiling Loss Estimates |
|---|---|
| Contiguous United States | 2005 – last full year at time of data version release |
| All regions outside the Contiguous United States | 1999 – last full year at time of data version release |
The accumulation of snow and particulate matter is cumulative and time-dependent by nature. Using full historical time-series data can improve the reliability of average snow and soiling loss estimates, and account for the effect of interannual variability on losses. In addition to local weather data and the PV system’s configuration (such as tracking and tilt), site-specific loss parameters (such as rainfall cleaning threshold or washing schedule) can further affect the magnitude of losses. Average loss estimates included in the SolarAnywhere average year summary file are generated using default values for loss parameters such as cleaning threshold, daily soiling rate, washing schedule, etc. The complete list of loss parameters and default values used in SolarAnywhere can be found in the SolarAnywhere API Documentation for snow and soiling losses.
To fully understand the complete range and uncertainty of loss estimates, SolarAnywhere supports a variety of snow and soiling loss models. For generating average snow losses, the NREL snow loss model (commonly referred to as the ‘Marion’ model) or the Townsend snow loss model may be selected. For generating average soiling losses, either the Humboldt State University (HSU) soiling model or Kimber soiling model may be specified. SolarAnywhere uses the latest version of these pvlib PV performance models available at the time of Average Year Summary file generation.
To include soiling and snow loss estimates in the Average Year Summary file, select the Average Soiling Losses and Average Snow Losses checkboxes under Datasets and Advanced Fields as shown in Figure 7.
Figure 7. Selecting Average Snow and Soiling Losses in the SolarAnywhere Data website

When the average year summary file is downloaded, the file will include the long-term average monthly soiling losses and snow losses as shown in Figure 8:
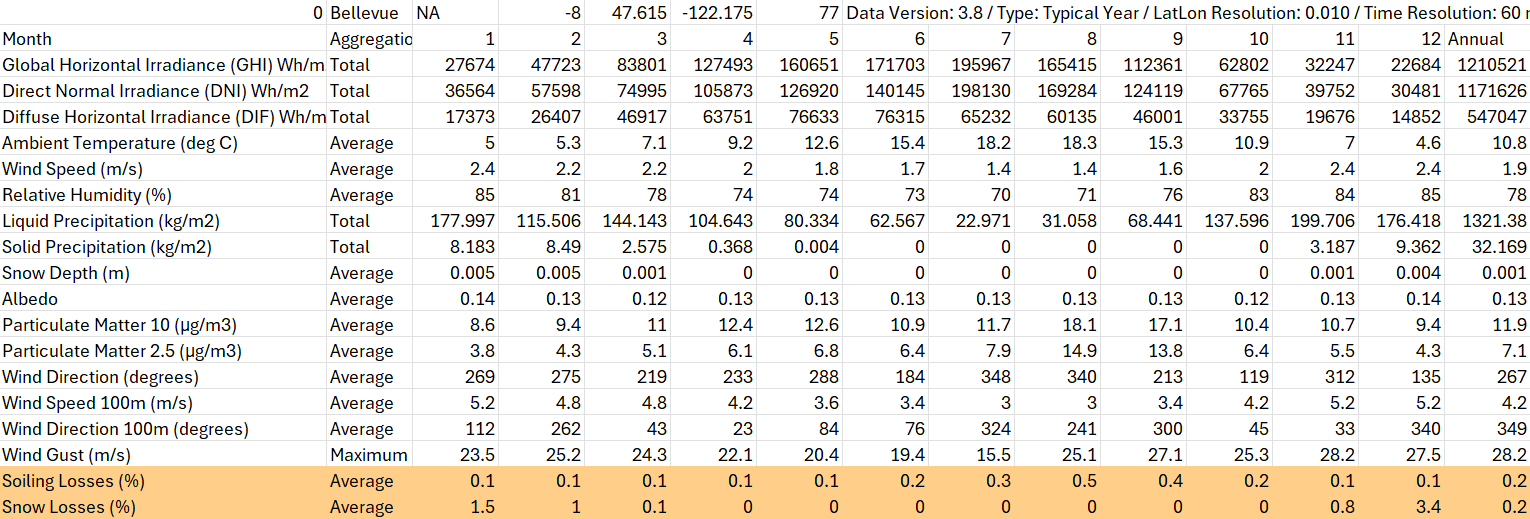
Figure 8: Example Snow and Soiling Loss data in the Average Year Summary file
To learn more about the SolarAnywhere loss methodology, validation and applicability of the data, visit these support center pages:
Average Plane-of-Array Irradiance (POAI)
Long-term average monthly total plane-of-array Irradiance (POAI) can be useful in solar prospecting, making it easy for solar developers and owners to quickly assess the PV project potential of any location across the globe.
Plane-of-array irradiance is defined as the irradiance incident on the plane of the PV array and is dependent on the sun position, array orientation (fixed vs. tracking), irradiance components, albedo and shading from near and far obstructions. SolarAnywhere uses community-trusted pvlib models in combination with the full historical time-series of SolarAnywhere irradiance and weather data to estimate POAI at each time step. Monthly totals are calculated from the historical time-series, then averaged for inclusion in the Average Year Summary file. The pvlib models use the Perez transposition model to determine the diffuse irradiance component.
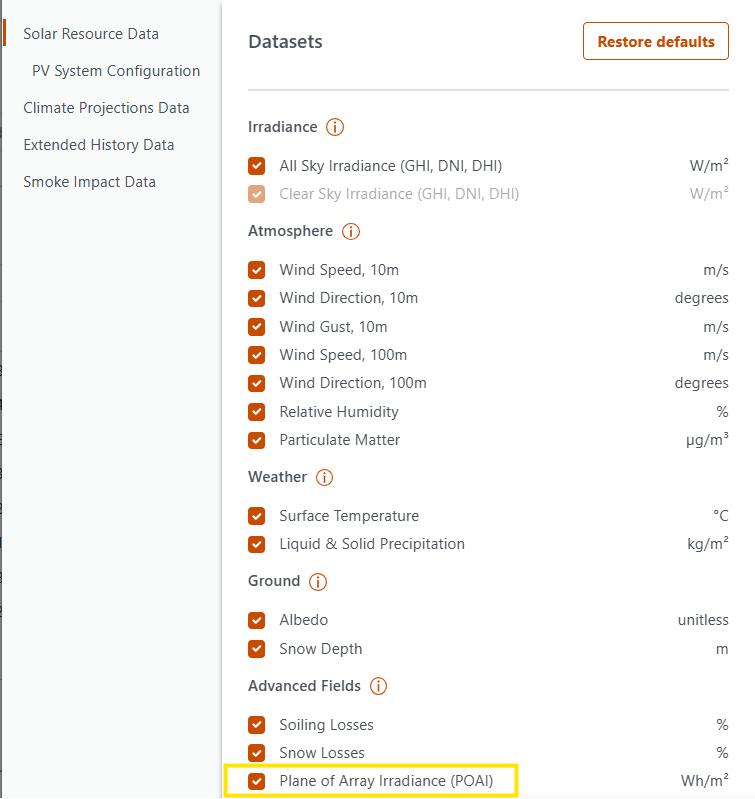
To include long-term average monthly total plane-of-array irradiance in the average year summary file, select the “Plane-of-array irradiance (POAI)” checkbox under Datasets and Advanced Fields as shown in Figure 9.
Figure 9. Selecting Average Plane-of-Array Irradiance (POAI) in the SolarAnywhere Data website
When the average year summary file is downloaded, it will include the long-term average monthly plane-of-array irradiance as shown in Figure 10:
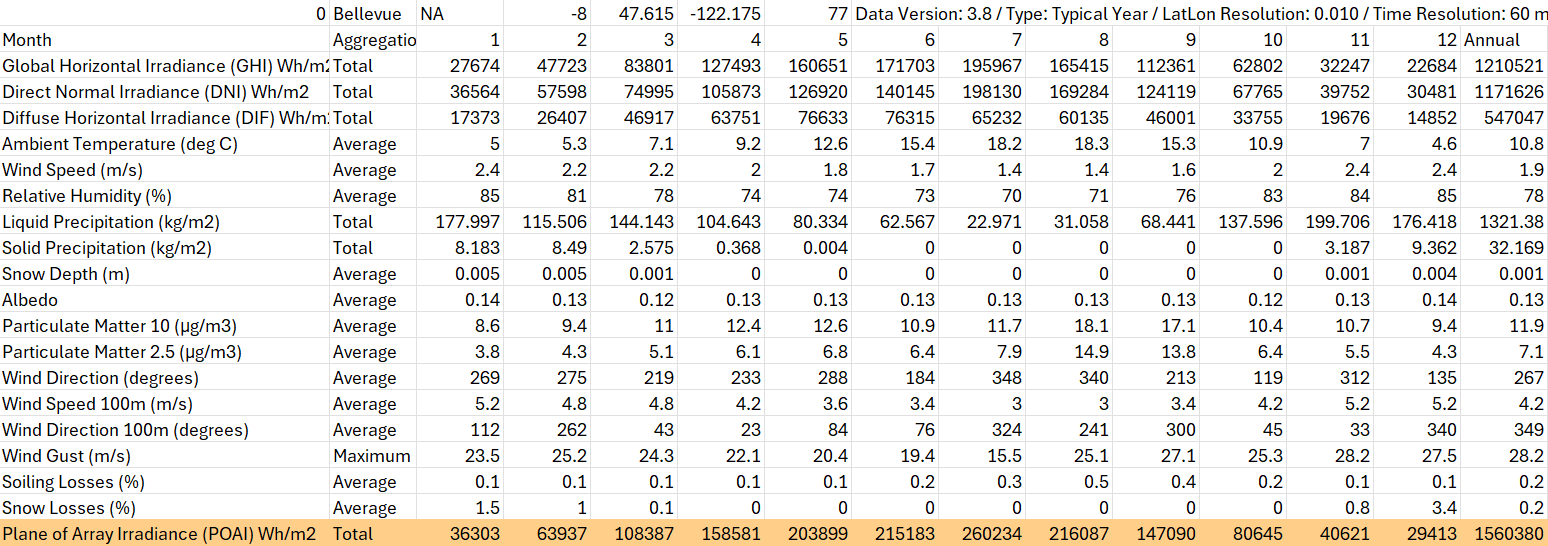
Figure 9: Example Plane-of-Array Irradiance in the Average Year Summary file
Array Configuration
When retrieving average snow losses, average soiling losses and/or average plane-of-array irradiance through the SolarAnywhere data website, users may specify PV array configuration parameters to make average snow and soiling loss estimates more project-specific. Because the array configuration options are only available for average snow losses, average soiling losses and/or plane-of-array irradiance datasets, at least one of these datasets must be selected to enable the array configuration. Within the array configuration, users can input the following parameters: mounting type, tilt, tracking rotation limit, azimuth, and relative row spacing (shown in Figure 11). Array configuration inputs can be found under the “PV System Configuration” tab on the left column.
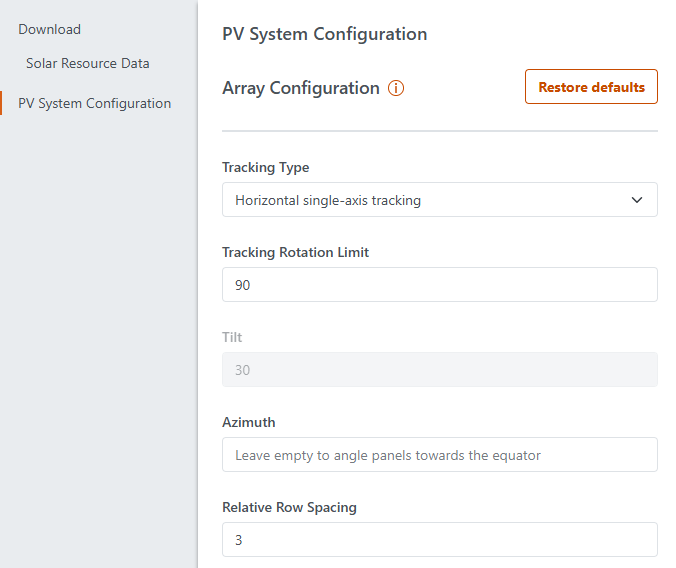
Figure 11. Specifying Array Configuration on the SolarAnywhere Data website
The below table outlines the configurable PV array configuration parameters through the SolarAnywhere data website. Note: additional array configuration parameters are available through the SolarAnywhere API.
| Input Parameter | Description | Default Value |
|---|---|---|
| Tracking Type | Horizontal single-axis tracking or fixed-tilt | Horizontal single-axis tracking |
| Tilt | An integer value between 0 to 90 degrees specifying tilt for fixed-tilt PV systems. [degrees] | 60 degrees |
| Tracking Rotation Limit | Rotation Limit for single-axis tracking PV arrays. [degrees] | 60 degrees |
| Azimuth | The direction towards which the PV panels are facing. [degrees] |
Northern Hemisphere: 180 degrees
Southern Hemisphere: 0 degrees |
| Relative Row Spacing | The inverse of the ground coverage ratio (GCR) and can be calculated as the ratio of row-to-row pitch to array length. [unitless] | 3 (GCR = 0.33) |
Soiling Loss Inputs
When downloading the soiling losses dataset in SolarAnywhere, users may choose between the Humboldt State University (HSU) soiling model (default) or the Kimber soiling model. The Kimber model uses daily soiling rates and manual wash input parameters, whereas the HSU model utilizes PM2.5 and PM10 data to estimate soiling losses. While both the HSU model and Kimber model allow users to specify the rainfall cleaning threshold, there are a variety of additional input fields made available when selecting the Kimber model (shown in Figure 12). Soiling loss inputs can be found under the “PV System Configuration” tab on the left column.
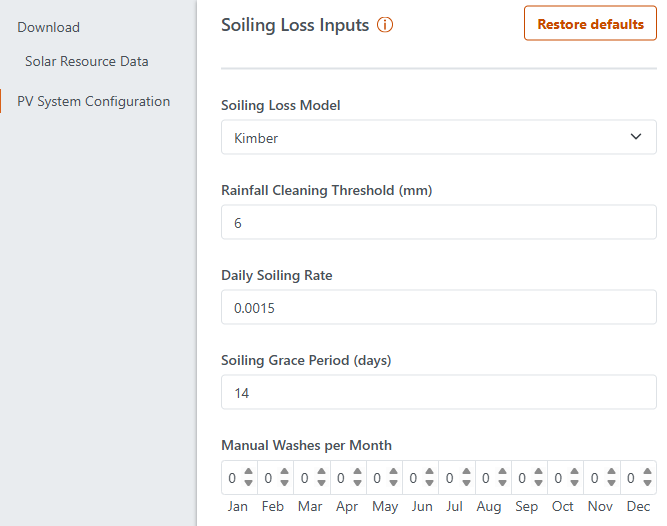
Figure 12. Specifying Soiling Loss Inputs on the SolarAnywhere Data Website
The below table outlines the configurable soiling loss inputs through the SolarAnywhere data website. Note: additional soiling loss inputs are available through the SolarAnywhere API.
| Soiling Loss Inputs | Soiling Loss Model | Description | Default Value |
|---|---|---|---|
| Rainfall cleaning threshold (mm) | HSU, Kimber | The amount of daily rainfall required to clean the panels completely. [mm] | 6 mm |
| Daily soiling rate | Kimber | The expected daily loss in energy output occurring due to soiling buildup on the modules and is expressed as a fractional loss per day. Only required for the Kimber soiling loss model. [unitless] | 0.0015 |
| Soiling grace period | Kimber | The number of days the ground is expected to be damp after each rainfall event. Soiling does not accumulate during this period. Only required for the Kimber soiling loss model. [days] | 14 |
| Manual washes per month | Kimber | The number of times a PV panel is cleaned during the month. Cleanings are assumed to be roughly evenly spaced. Only required for the Kimber soiling loss model. [unitless] | 0 |
Snow Loss Inputs
When downloading the snow losses dataset on the SolarAnywhere data website, users may choose between the NREL snow loss model (default) and the Townsend snow loss model. The Marion model uses time-series weather data to estimate snow losses in each time step, whereas the Townsend model uses monthly average snowfall and snow event data to calculate losses. When selecting NREL for the snow loss model, users may adjust the number of parallel strings along the row height. When choosing the Townsend model, users are prompted to specify additional parameters including row slant height and ground clearance. Figure 13 displays the available snow loss inputs. Snow loss inputs can be found under the “PV System Configuration” tab on the left column.
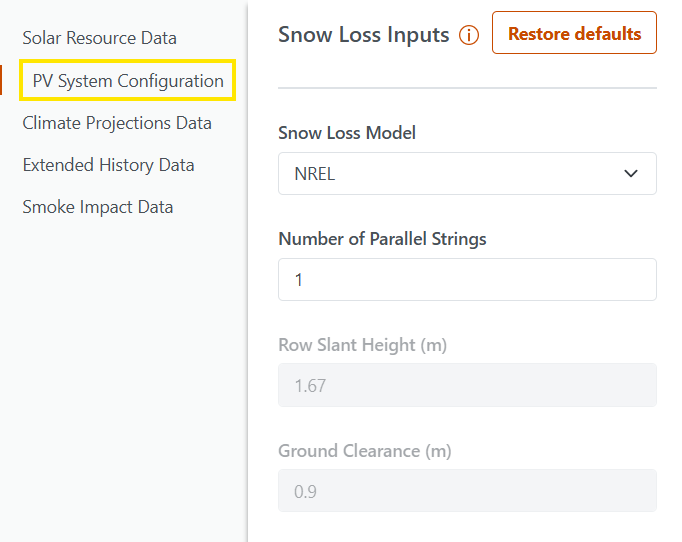
Figure 13: Specifying Snow Loss Inputs on the SolarAnywhere Data Website
The below table outlines the configurable snow loss inputs through the SolarAnywhere data website. Note: additional snow loss inputs are available through the SolarAnywhere API.
| Snow Loss Inputs | Snow Loss Model | Description | Default Value |
|---|---|---|---|
| Number of parallel strings | NREL, Townsend | The number of parallel-connected strings along a row slant height. [unitless] |
Fixed arrays: 2 Tracking arrays: 1 |
| Row Slant Height | Townsend | The row length in meters of the slanted plane-of-array dimension. [meters] | 1.67 m |
| Ground Clearance | Townsend | The clearance between the bottom edge of the module and the ground. This impacts how much snow might accumulate after sliding off before backing up on the module. [meters] | 0.90 m |
The PV array configuration parameters, snow loss inputs and soiling loss inputs specified by the user will be included in item h. of the notes section (as shown in Figure 14).
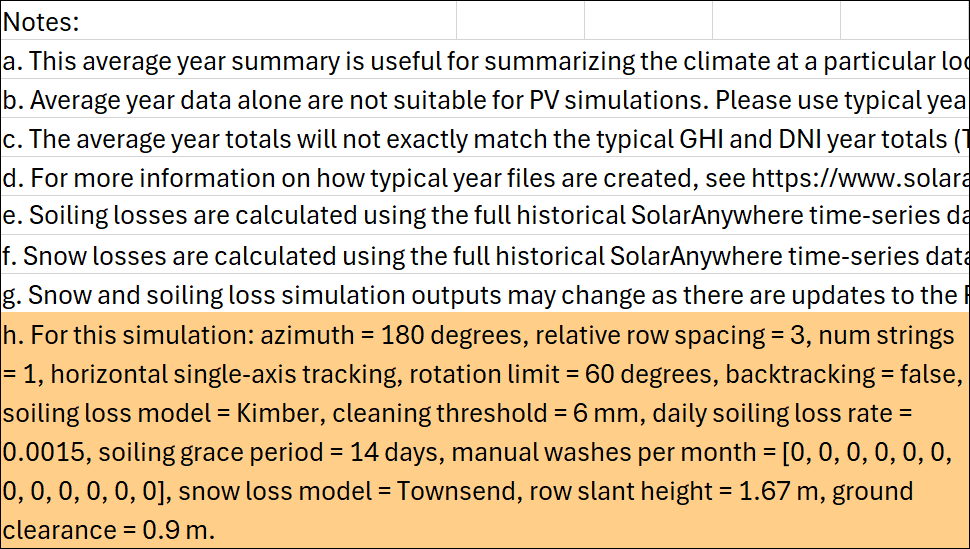
Figure 14: Example Average Year Summary file notes section