Executive Summary
SolarAnywhere® is a software-as-a-service product maintained by Clean Power Research® that provides on-demand access to bankable solar data and intelligence. The software and data quality are mature in development, adoption and validation.
Irradiance data are generated using visible- and infrared-channel data captured by geosynchronous orbiting satellites. The dataset is spatially and temporally consistent, and geographically precise. SolarAnywhere offers more than two decades of record, operates independently of ongoing ground measurements and is available in near real time.
SolarAnywhere is widely used for independent and bankable solar resource assessment, operational monitoring and solar forecasting. SolarAnywhere global horizontal irradiance (GHI) data is shown to be accurate within +/- 4.2% on an annual basis with 95% confidence.
The statistics presented in Figure 1 are representative of product performance but should not be take as an absolute indicator of accuracy. For additional information, see Validation Methodology.
Figure 1: SolarAnywhere GHI Annual Accuracy Metrics
Table of Contents
Introduction
This document provides up-to-date reference information and validation statistics for SolarAnywhere Data, an irradiance data product from Clean Power Research. The document version 2023.08_3.7 was last updated in August 2023 for SolarAnywhere historical irradiance model version 3.7 (V3.7).
About Clean Power Research
Clean Power Research® has delivered award-winning cloud software solutions to utilities and industry for 20 years. Our PowerClerk®, WattPlan® and SolarAnywhere® product families allow our customers to make sense of and thrive amid the energy transformation. Clean Power Research has offices in Napa, CA, and Kirkland, WA. For more information, visit www.cleanpower.com.
About SolarAnywhere
SolarAnywhere irradiance data are generated using visible and infrared-channel data captured by geosynchronous orbiting satellites. The satellite images are processed using the most advanced algorithms developed by Dr. Richard Perez at the University at Albany (SUNY). These algorithms extract cloud indices from the satellite’s visible and infrared data. A self-calibrating feedback process adjusts for arbitrary ground surfaces such as terrain and albedo. The cloud indices are used to modulate physically based radiative transfer models describing localized clear sky climatology.
The Perez model is applied in a pseudo-empirical fashion that is periodically calibrated with a select few ground stations. However, it operates largely independent of ongoing ground data input. This approach is unique to the industry and enables ground-to-satellite correlation studies to be truly based on two independently derived measurement sources.
SolarAnywhere irradiance data are generated in both global horizontal (GHI) and direct normal (DNI) irradiance components. The following geometric balancing equation is used to calculate diffuse horizontal irradiance (DHI):
DHI = GHI - DNI*cos(αzenith)
Clean Power Research has an exclusive relationship with Dr. Perez and SUNY to implement the latest satellite-to-solar irradiance methodology advances. More information on the extensive validation of the Perez model can be found in the references section.
In agreement with the U.S. Department of Energy through the National Renewable Energy Laboratory (NREL), Perez model-based satellite irradiance data comprised the 2005 (SUNY version 1) and 2010 (SolarAnywhere version 2.3) National Solar Radiation Database (NSRDB) releases. While the output format of SolarAnywhere satellite irradiance data is similar to NSRDB data, SolarAnywhere now provides more recent and more accurate datasets intended for commercial use.
The newest version of the SolarAnywhere model has been implemented operationally as Version 3.7. SolarAnywhere satellite irradiance data are available for specific sites on a 1 km x 15-min or 10 km x hourly basis, and from 1998 to the present hour depending on geographic availability. High resolution, 0.5 km x 5-min data are are available for the continental United States beginning Jan. 1, 2020.
Validation Methodology
Data from select ground stations are used as a reference to calculate the error and uncertainty of the operational SolarAnywhere irradiance model. A high-quality reference dataset is required for the validation statistics to represent, to the maximum extent possible, model performance rather than ground data inaccuracies. Therefore, only the highest quality reference stations are used as validation sites, and the data are screened for data quality issues. The validation sites span a wide geographic area and a variety of terrain and climate types to assess the model’s performance in heterogeneous conditions. Most are part of the World Radiation Monitoring Center Baseline Surface Radiation Network (BSRN).
The SolarAnywhere model has three critical properties for the purposes of data validation and overall confidence in the model’s performance. First, the model is never fit to individual validation sites. Second, the model operates independently of ongoing ground data input. Third, SolarAnywhere utilizes a single historical model regardless of the time and location (with adaptations for each satellite platform). Because of these properties, the validation statistics are representative of the model’s performance not just at the validation sites, but also for the model generally. The GHI, DNI and Diffuse Horizontal Irradiance (DIF) data are compared at hourly, monthly and annual intervals using traditional error metrices such as Mean Bias Error (MBE), Mean Absolute Error (MAE) and Root Mean Square Error (RMSE).
The error metrics are defined by the following formulas:
- rMBE=\frac{\sum_{i=1}^N (x_i^{SA} - x_i^{obs})}{N}\frac{100\%}{\overline{x_l^{obs}}}
- rMAE=\frac{\sum_{i=1}^N | (x_i^{SA} - x_i^{obs}) | }{N}\frac{100\%}{\overline{x_l^{obs}}}
- rRMSE=\sqrt\frac{\sum_{i=1}^N (x_i^{SA} - x_i^{obs})^{2}}{N}\frac{100\%}{\overline{x_l^{obs}}}
An x represents the variable being considered (either GHI, DNI or DHI); N is the number of data points used; and the superscripts SA and obs stand for SolarAnywhere and ground observed data. The errors metrics are normalized by the mean of the ground observed data and denoted by rMBE, rMAE and rRMSE. Hoff et al. have previously discussed the applicability of various error metrics for solar in the paper, “Reporting of Irradiance Model Relative Errors.” Standard deviations and confidence intervals are also presented.
The statistics presented here are representative of product performance, but should not be taken as an absolute indicator of accuracy. Despite best efforts to quality control the reference data, no reference dataset is perfect. Where possible, SolarAnywhere data is tested against GHI calculated from measured direct and diffuse irradiance (DHI + DNI*cos(αzenith)). The component sum measurements are generally more accurate than pyranometer measurements of GHI; however, such measurements are not available for all validation sites. For consistency, the GHI statistics presented in this document use pyranometer measurements as the reference.
Validation Results
Validation results are organized first by period (long-term, annual, monthly and hourly) and second by geography. Each period is associated with a use case for the data. For example, long-term averages are appropriate for solar resource assessment, while hourly statistics are more relevant to real-time performance monitoring.
Long-Term Averages
The SolarAnywhere database includes more than twenty years of satellite-derived irradiance data. The long, consistent record is particularly useful for solar resource assessment. Long-term averages are derived from the full time series, and they may be summarized by a typical year file and used to project the energy production for the life of a solar plant. For these purposes, it’s useful to understand the uncertainty in the long-term solar resource data for a given site.
Twenty-four years of reference data (1998-2022) are considered for reference stations wherever possible. Previous validation studies of satellite irradiance models have considered approximately 5-15 years of data for each site. Studying two decades for each site has only recently become possible. The expanded period confirms the consistency of the model across many years and multiple generations of satellite hardware. In addition, twenty years is significant because it exceeds the term of the average power purchase agreement (PPA). The validation period used for other validation sites depends on data availability.
The GHI and DNI average mean bias error for each validation site is plotted on the maps below (Figure 2). Each point represents the full period for which validation data are considered. A bias close to zero means that the model is well calibrated; in other words, on average, the model does not over- or underpredict the solar resource.
For all locations, the mean bias error of GHI falls between -4.2% and +4.2%. The mean bias is +0.01% and the standard deviation is 2.1%. In North America, the mean bias error of GHI falls between -3.4% and +3.3% with a standard deviation of 1.7%.
Annual
Annual insolation is used in a variety of applications including:
- Resource assessment — to compare recent and long-term satellite-derived data to a year-long ground measurement campaign
- Development and financing — to assess interannual variability and the ability of a solar project to meet debt coverage requirements in a low insolation year
- Operations and asset management — to compare expected to actual production annually
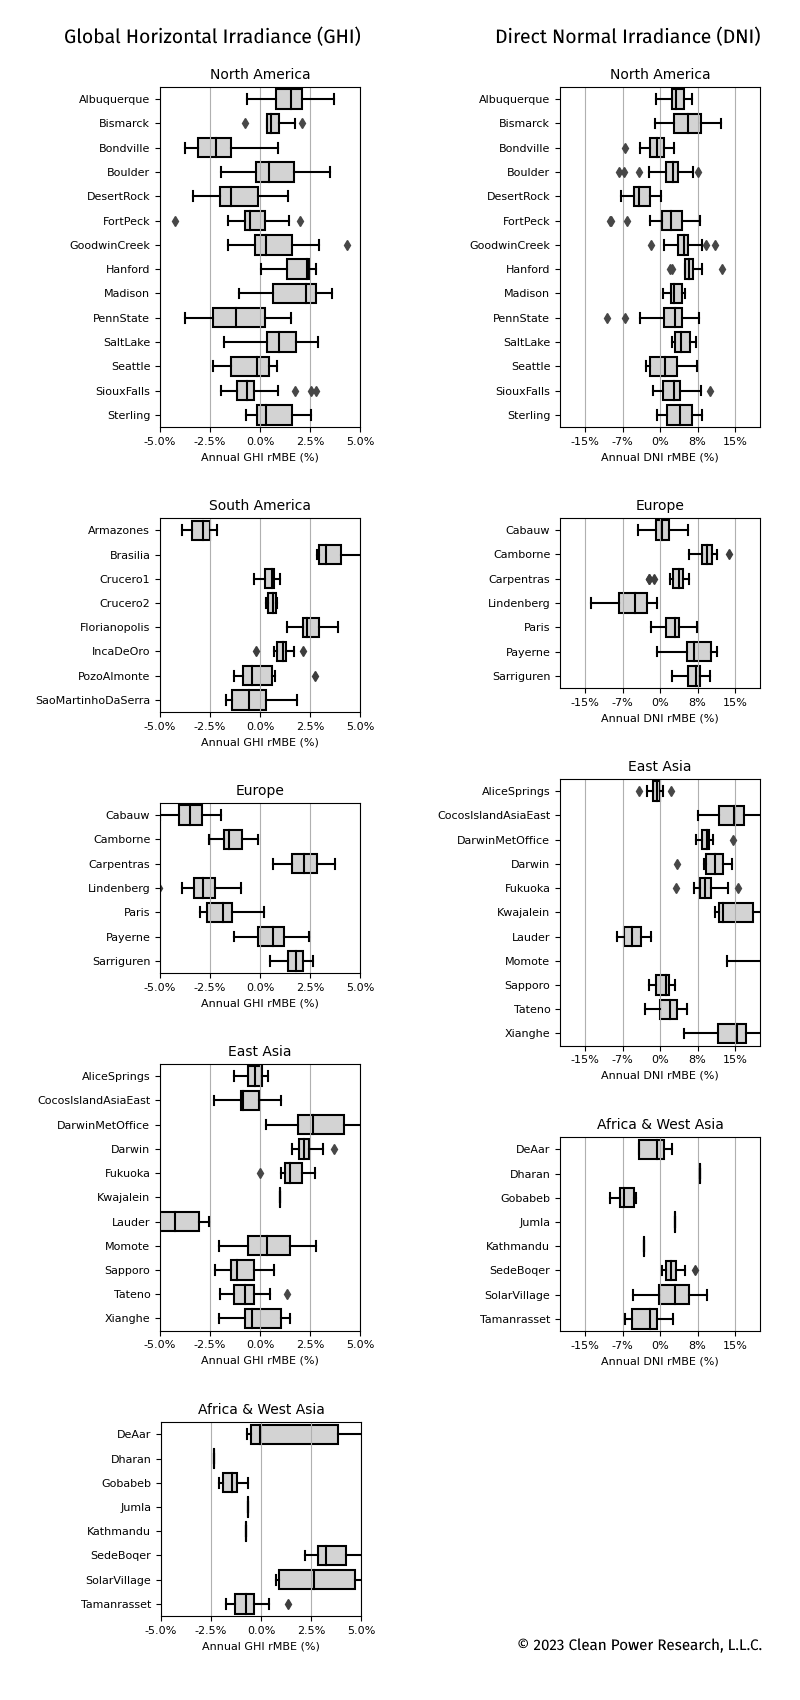
For these or related purposes, an assessment of the distribution of annual errors by validation site is crucial for understanding the consistency and uncertainty of the satellite model. Long-term averages alone hide offsetting errors. The box plot in Figure 3 below illustrates the interquartile range of GHI annual mean bias error for each validation site. Narrower bars indicate better model precision and correlation with the validation sensors that over time have some variability in calibration and maintenance. Each dot represents one site-year of data. A white box represents the mean. In all, 1,175 site-years of data are shown.
Most sites have a similar error distribution and a mean within a few percent of neutral bias. The data scatter after grouping by site illustrates that model performance depends on both location and weather. Inconsistency in the quality or calibration of the reference measurements also results in scatter.
Because of this, and the relatively few, high-quality ground stations compared to the variety of terrain and climate regions, it’s difficult to extrapolate model performance at a given location to the associated region or climate region. Rather, the data indicates the model performs well at all locations. Detailed statistics by site can be found in the appendix.
The wider distribution of DNI is expected due to the introduction of the decomposition model. SolarAnywhere uses the DIRINDEX model developed by Perez et al. to derive DNI from GHI and several other inputs. The statistics have been evaluated to confirm that the operational SolarAnywhere model accurately applies the decomposition model and that it is well calibrated. Accurate DNI data is important for plane of array irradiance and PV power simulations.
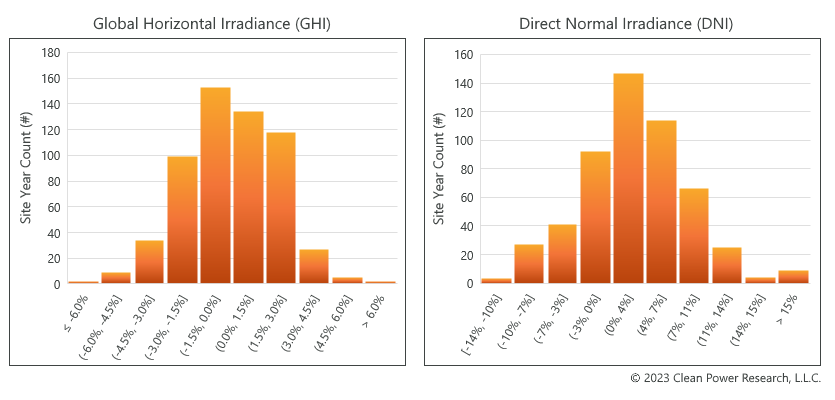
The histograms in Figure 4 show the distribution of annual mean bias error for both GHI and DNI for all validation sites.
For GHI, the data forms a tight distribution around neutral bias, as shown in Figure 5. The mean of all points is +0.01%, indicating that on average, the model does not materially over- or under-predict annual insolation. The standard deviation is 2.1%, meaning two thirds of the site-years fall within +/- 2% of the reference. Assuming a normal distribution and that each site-year of data is independent, the 95% confidence interval of GHI annual mean bias error is [-4.16%, +4.17%] (N = 583).
For DNI, the mean of all points is 3% and the standard deviation is 6.2%. The 95% confidence interval of DNI annual mean bias error is [-9.2%, +15.1%] (N = 536). An additional explanation of data selection and data quality is presented in the appendix.
Figure 5: SolarAnywhere GHI Annual Accuracy Metrics
All statistics make use of the 1 km spatial resolution model, which is standard for SolarAnywhere timeseries data (where available). Previously published validation of the lower resolution 10 km2 spatial resolution model has shown that the 95% confidence interval of GHI annual mean bias error is +/- 5%. The higher accuracy demonstrated here is attributed to model improvements and the increased spatial resolution. The higher resolution data better capture cloud formation in heterogeneous terrain and microclimates. Over complex and coastal areas, the 1 km SolarAnywhere data are more accurate than the 10 km SolarAnywhere data and should be strongly considered as the preferred bankable resource measurement.
Clean Power Research has performed hundreds of site-specific resource assessment and ground tuning studies that compare SolarAnywhere Data to privately owned, high-quality ground-based irradiance measurements. The results of these studies support the conclusion that the validation presented here fairly represents the accuracy and uncertainty of SolarAnywhere Data for the multitude of locations where solar is being considered.
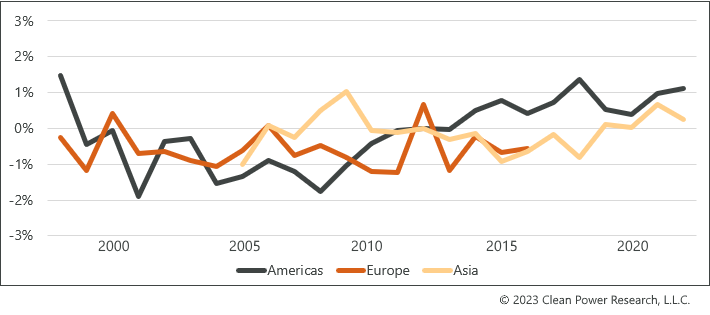
Finally, the model’s temporal consistency is evaluated. Temporal consistency means that model performance is consistent across the entire period of data availability. Consistent model performance enables more accurate solar resource assessment campaigns (also known as ground tuning) and increased ability to spot trends such as module degradation in operational asset performance. A temporally consistent model is a requirement for analyzing multi-decade trends in weather that have the potential to impact solar project design and energy yield.
Since each region has multiple generations of satellite input sources, and regional atmospheric properties change over time, temporal consistency is not a given. For that reason, the entire period of data availability is evaluated for changes in bias over time. Only the validation stations with the longest history are considered for evaluation of temporal consistency.
As shown in Figure 6, evaluation of the model across the entire period of data availability shows consistent performance over time—there are no trends or jumps in bias. Therefore, SolarAnywhere users can feel confident comparing recent data to long-term averages for applications including solar resource assessment and performance analysis. In addition, the results show that SolarAnywhere is suitable for analysis of long-term trends in solar resource. For auxiliary data like wind and temperature, datasets are selected and maintained to maximize spatial and temporal consistency.
Monthly and Hourly
Asset managers may use monthly data to understand PV performance in the context of recent weather. Plant performance is weather normalized to isolate performance metrics from variability in monthly insolation, temperature, etc. Hourly data may be used to support real-time operations and maintenance (O&M). In addition, hourly error metrics are useful for understanding how the model performs in various weather conditions.
In general, as the averaging period is shortened (e.g., from annual to monthly, or monthly to hourly), errors increase due to the fundamental properties of averages. MAE and RMSE summarize the accuracy of hourly and monthly data. As shown in Figure 7, the scatter in the data dominates the bias for these shorter periods, which is already characterized for annual and long-term averages.
Figure 7: SolarAnywhere GHI Monthly and Hourly Accuracy Metrics
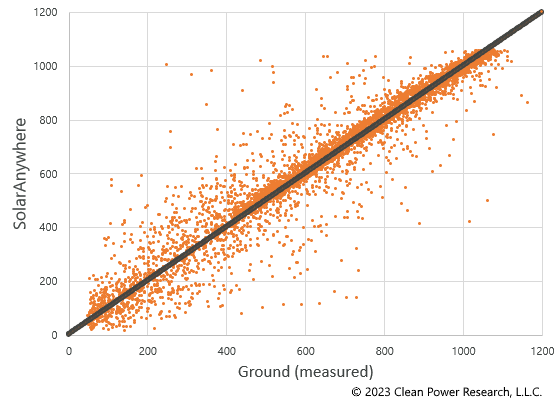
A scatterplot of SolarAnywhere versus reference half-hourly global horizontal irradiance shows how the model performs for cloudy, partly cloudy and sunny conditions. Perfect correlation would result in a straight line from zero irradiance in the bottom left corner of the graph, to maximum irradiance in the top right.
Data for the Desert Rock SURFRAD ground station, 2022, are shown in Figure 8 as an example. Inspection reveals that the model performs well for low through high irradiance conditions.
Climate Classification
The Köppen-Geiger climate classification categorizes regions across the globe based on factors such as temperature and precipitation. The five main climatic zones and sub-types in the Köppen classification are listed in Figure 9.
Figure 9: Köppen-Geiger Climatic Zones
The significance of the third letter in the Köppen-Geiger Climate Classifications is listed in Figure 10.
Figure 10: Köppen-Geiger Climate Classifications: Significance of the Third Letter in the Climate Naming Convention
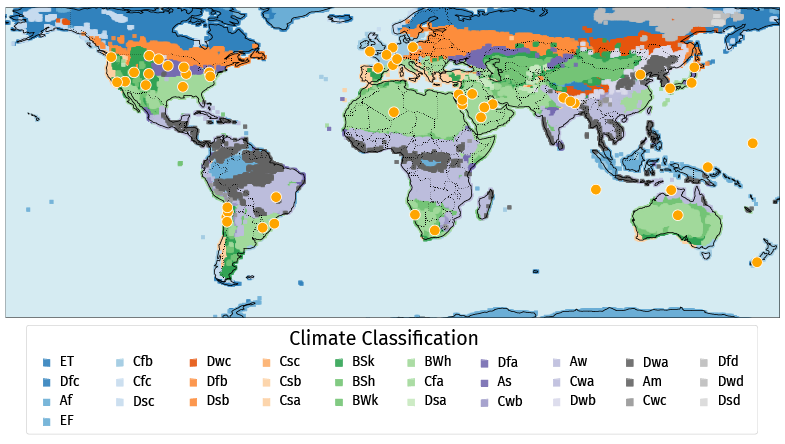
Figure 11 shows a global map of Köppen-Geiger classifications and list of ground stations used for v3.7 data validation.
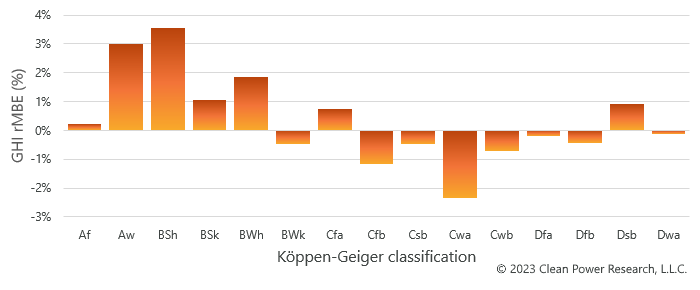
Figure 12 shows the annual bias (rMBE) of SolarAnywhere GHI data model based on the Köppen-Geiger classifications. Generally, the deviations are scattered and no strict relation between geographical position and error values appears present. The mean bias error for all climate categories across the globe falls within the +/-4.0% which is consistent with the annual MBE error for GHI when sites are not categorized by climatic regions. This shows that the SolarAnywhere data model accuracy is consistent across all regions.
Conclusion
SolarAnywhere is the most trusted provider of bankable solar resource data to the solar industry. The satellite-derived dataset is consistent across the geographic coverage area and 20+ years of record. What’s more, the data are available on-demand.
The information presented validates the low uncertainty of SolarAnywhere Data and its use in solar resource assessment for photovoltaic (PV) project financing. The annual GHI uncertainty of SolarAnywhere Data is less than 4.2%. The model is shown to be consistent spatially and across over two decades of record. Monthly and hourly statistics demonstrate the ability of the model to capture shorter periods and the full range of possible weather for operational use cases.
SolarAnywhere ensures the highest data quality globally by using a single, versioned satellite-to-solar model everywhere. SolarAnywhere may be used as long-term solar reference independent of the need for regional or site-specific ground-tuning. This unique capability was clearly demonstrated when SolarAnywhere Data made it possible to detect an unreported irradiance sensor calibration issue at one of the nation’s most trusted reference stations: the SURFRAD station of Fort Peck, Montana.
Clean Power Research continues to invest in SolarAnywhere to meet the needs of the solar industry and accelerate the clean energy transformation.
Need a printable version of this validation document?
To see the results of an independent evaluation of SolarAnywhere Data from Fraunhofer Institute for Solar Energy Systems ISE, click the link below.
Appendix
Input Data Sources
SolarAnywhere uses a satellite-to-solar algorithm to estimate irradiance from geosynchronous satellite images. The raw input data for the irradiance data include:
Auxiliary data including aerosol optical depth, wind speed, ambient temperature, relative humidity, solid precipitation, liquid precipitation and snow depth are derived from various numerical weather models.
Reference Stations
Station Selection Criteria
Meaningful validation requires a high quality refence. To ensure the validation statistics are representative of the model, the validation stations are required to meet the following criteria:
- A credible organization maintains responsibility for the installation
- Metadata such as sensor type, location, etc. exists; sensors are secondary standard or better
- The data are publicly available
- The period of record is at least 1 year
- The data generally pass standard quality control and the station has >75% availability
- The station is representative of locations where solar PV is installed
The following stations met these criteria and were used in validation of SolarAnywhere:
Quality Control
Data from each station must pass statistical data quality checks similar to those recommended by the BSRN. In addition, data are reviewed by a data analyst to ensure the measurements are not affected by the following common issues:
- Soiling
- Shading
- Calibration drift
Data that fails to pass the quality control are excluded from the analysis. If the issues with the station are persistent, the station is excluded from the analysis entirely. Deviation from SolarAnywhere is not used as a reason to exclude data.
High quality DNI data are more difficult to obtain than GHI. DNI reference measurements are checked by comparing measured GHI to GHI calculated from measured direct and diffuse irradiance (DHI + DNI*cos(αzenith)). If the comparison is inconsistent beyond certain thresholds, the DNI measurements are excluded from the validation.
Statistics
Detailed statistics by site are available in the print version of this document.
Version Control
General
SolarAnywhere uses version control to ensure results are reproducible from one user or context to another. Irradiance data released as “Archive,” denoted by prefix “A” in the irradiance observation type, will not change for that model version. New model versions are expected to have somewhat different irradiance data as newer, more accurate modeling techniques are applied to the historical record of satellite images.
Click here to see information on current and past versions of SolarAnywhere Data.
Known Limitations and Errata
- The IR model is not used for the Meteosat First Generation satellites (MFG) in the W. Asia and Africa region due to probable sensor degradation, affecting data from the beginning of the record through 2016. This results in higher data uncertainty in locations with persistent snow cover. Since the IR model is used for newer satellites covering the region, temporal inconsistencies may exist in the long-term record.
- Initial coverage for the East Asia and Oceania regions includes data from 2005 to present. For periods prior to 2005, testing revealed data quality issues from the older satellites in this region. If this data can be made to pass our validation requirements, we will make earlier data available.
- On July 15, 2021, Clean Power Research corrected an issue affecting certain snow depth data requests from SolarAnywhere. The issue resulted in incorrect average snow depth values for hourly, monthly and annual data (all data versions, globally). Thirty-minute and 15-minute snow-depth data were unaffected. The data has been corrected for all new data requests. We estimate that snow loss estimates may shift by 0 to -2% (absolute percent difference) when using the old versus corrected data in the Marion snow loss model; however, results will vary depending on the specific location, system type and application.
- Model versions 3.4 and 3.5 underestimate GHI in snow-affected areas in the GOES-West region in the winter of 2021-2022. The GOES-17 IR band data has known issues; reasonable efforts are made to use what’s available. The issue is corrected in versions 3.6 and later.
References
The following peer-reviewed articles describe the SUNY model underlying SolarAnywhere simulations:
- Perez R., P. Ineichen, K. Moore, M. Kmiecik, C. Chain, R. George and F. Vignola, (2002): A New Operational Satellite-to-Irradiance Model. Solar Energy 73, 5, p. 307-317.
- Perez R., P. Ineichen, M. Kmiecik, K. Moore, R. George and D. Renné, (2004): Producing satellite-derived irradiances in complex arid terrain. Solar Energy 77, 4, p. 363-370.
- Perez, R., P. Ineichen, E. Maxwell, R. Seals and A. Zelenka, (1992): Dynamic Global-to-Direct Irradiance Conversion Models. ASHRAE Transactions-Research Series, p. 354-369.
- P. Ineichen, (2008): Comparison and validation of three global-to-beam irradiance models against ground measurements. Solar Energy 82, p. 501-512
The following articles describe the performance of the SolarAnywhere V3 model:
- Perez R., S. Kivalov, A. Zelenka, J. Schlemmer and K. Hemker Jr., (2010): Improving the Performance of Satellite-to-Irradiance Models using the Satellite’s Infrared Sensors. Proc., ASES Annual Conference, Phoenix, Arizona.
- Dise J., Kankiewicz, A., Schlemmer, J., Hemker, K., Kivalov, S., Hoff, T., Perez, R., (2013): Operational Improvements in the Performance of the SUNY Satellite-to-Solar Irradiance Model Using Satellite Infrared Channels. Proc., 39th Annual IEEE Photovoltaic Specialists Conference, Tampa, Florida.
- Perez, Richard & Schlemmer, James & Hemker, Karl & Kivalov, Sergey & Kankiewicz, Adam & Gueymard, Chris. (2015). Satellite-to-Irradiance Modeling – A New Version of the SUNY Model. 10.1109/PVSC.2015.7356212.
The following articles include validations of the SUNY/SolarAnywhere model in different environments:
- Wilcox, S., R. Perez, R. George, W. Marion, D. Meyers, D. Renné, A. DeGaetano, and C. Gueymard, (2005): Progress on an Updated National Solar Radiation Data Base for the United States. Proc. ISES World Congress, Orlando, FL
- Vignola F., and R. Perez (2005): Solar Resource Data base for the Pacific Northwest Using Satellite Data. Final Report to USDOE. http://solardata.uoregon.edu/download/misc/doefinalreport.pdf
- Wilcox, S., M. Anderberg, R. George, W. Marion, D. Myers, D. Renné, W. Beckman, A. DeGaetano, C. Gueymard, R. Perez, N. Lott, P. Stackhouse and F. Vignola, (2006): Towards Production of an Updated National Solar Radiation Data base. Proc. ASES Annual Conference, Denver, CO
- Paul W. Stackhouse, Jr., Taiping Zhang, William S. Chandler, Charles H. Whitlock, James M. Hoell, David J. Westberg, Richard Perez, and Steve Wilcox, (2008): Satellite Based Assessment of the NSRDB Site Irradiances and Time Series from NASA and SUNY/Albany Algorithms. Proc. ASES Annual Meeting, San Diego, CA.
- Perez R., J. Schlemmer, D. Renné, S. Cowlin, R. George and B. Bandyopadhyay, (2009): Validation of the SUNY Satellite Model in a Meteosat Environment. Proc. ASES Annual Conference, Buffalo, New York.
Reference station references:
- BSRN: Driemel, A., Augustine, J., Behrens, K., Colle, S., Cox, C., Cuevas-Agulló, E., Denn, F. M., Duprat, T., Fukuda, M., Grobe, H., Haeffelin, M., Hodges, G., Hyett, N., Ijima, O., Kallis, A., Knap, W., Kustov, V., Long, C. N., Longenecker, D., Lupi, A., Maturilli, M., Mimouni, M., Ntsangwane, L., Ogihara, H., Olano, X., Olefs, M., Omori, M., Passamani, L., Pereira, E. B., Schmithüsen, H., Schumacher, S., Sieger, R., Tamlyn, J., Vogt, R., Vuilleumier, L., Xia, X., Ohmura, A., and König-Langlo, G.: Baseline Surface Radiation Network (BSRN): structure and data description (1992–2017), Earth Syst. Sci. Data, 10, 1491-1501, doi:10.5194/essd-10-1491-2018, 2018.
- KACARE: Erica Zell, Sami Gasim, Stephen Wilcox, Suzan Katamoura, Thomas Stoffel, Husain Shibli, Jill Engel-Cox, Madi Al Subie: Assessment of solar radiation resources in Saudi Arabia, Solar Energy, Volume 119, 2015, Pages 422-438, ISSN 0038-092X, https://doi.org/10.1016/j.solener.2015.06.031.Reference to KACARE Data.
To see the results of an independent evaluation of SolarAnywhere Data from Fraunhofer Institute for Solar Energy Systems ISE, click the link below.
