
Introduction
Soiling losses due to the accumulation of dirt, dust and organic/inorganic contaminants on PV panels can reduce energy output by obstructing the sunlight available for energy conversion. It is estimated that soiling losses can range from zero to 7% in the United States and reach as high as 50% in certain parts of the world.
Soiling can be a significant source of PV production uncertainty and financial risk. Studies have shown that soiling losses can contribute up to 1-4% of the uncertainty (1-sigma) in energy production estimates depending on the project location and system configuration.
A key challenge in accurately estimating soiling losses is that they are highly site-specific. Since local weather is always in flux—changing from season to season and year to year—soiling losses can exhibit high seasonal and inter-annual variability. SolarAnywhere time-series weather data at a project location can be used in conjunction with soiling loss models to predict the impact of soiling on PV energy output more accurately.
Using time-series data with community-trusted soiling loss models in SolarAnywhere
Since the accumulation of dust and contaminants on PV panels is a cumulative process, time-series data may be more accurate for modeling site-specific soiling losses. An NREL study found that in comparison with other environmental and meteorological parameters such as precipitation and wind direction, particulate matter (PM10 and PM2.5) has the highest correlation with soiling losses.1
With SolarAnywhere, customers get access to the full historical time-series weather data, including particulate matter data at their project site. SolarAnywhere’s high-fidelity weather data can be used with community-trusted soiling loss models, such as the pvlib Humboldt State University (HSU) model, to get site-specific soiling loss estimates, on-demand.2,3
SolarAnywhere customers can model soiling loss estimates with SolarAnywhere V3.5 and newer weather data versions. The data is available globally for historical, real-time, and forecast (up to 2 days ahead) time periods. Soiling losses can be included in average year summary file downloads, or requested using the SolarAnywhere API. To learn more about soiling loss modeling using SolarAnywhere API, refer to the API documentation. Contact us to get a demo.
Methodology
SolarAnywhere energy modeling services provided through the API support the soiling loss models developed by Coello and Boyle, also referred to as the HSU model and the Kimber model in pvlib.2,5
The HSU model estimates total accumulated mass of deposited particles on the module surface using ambient PM2.5 and PM10 concentrations. Rainfall is considered as the primary and single source of removal of accumulated dust.
Another variable that affects the rate of particulate mass deposition on PV panels is the deposition or settling velocity. The pvlib HSU model available in the SolarAnywhere API uses a settling velocity of 0.0009 meters per second and 0.004 meters per second for PM2.5 and PM10 respectively. The original study concluded that the use of above specified static settling velocities results in the most accurate outputs.2 The complete list of input parameters used in the HSU model and their default values are listed in Table 1.
Table 1: Input Parameters and Default Value Used in the HSU Soiling Model
| HSU Soiling Loss Inputs | Definition | Default Value in pvlib | Can be specified by the user in the SolarAnywhere API |
|---|---|---|---|
| cleaning_threshold | Amount of rain in an accumulation period needed to clean the PV modules. [mm] | 6 | Yes |
| depo_veloc | Deposition or settling velocity of particulates. [m/s] | Particulate Matter 2.5: 0.0009, Particulate Matter 10: 0.004 | No |
| rain_accum_period | Period for accumulating rainfall to check against cleaning_threshold. [hours] | 24 | Yes |
| rainfall | Rain accumulated in each time period. [mm] | SolarAnywhere time-series data | No |
| Surface_tilt | Tilt of the PV panels from horizontal. [degree] | Fixed-tilt: specified by the user, Single-axis tracking: Panel orientation time-series calculated from user-specified rotation limit | Yes |
| PM2.5, PM10 | Concentration of airborne particulate matter (PM) with aerodynamic diameter less than 2.5 and 10 microns, respectively. [g/m^3] | SolarAnywhere time-series data | No |
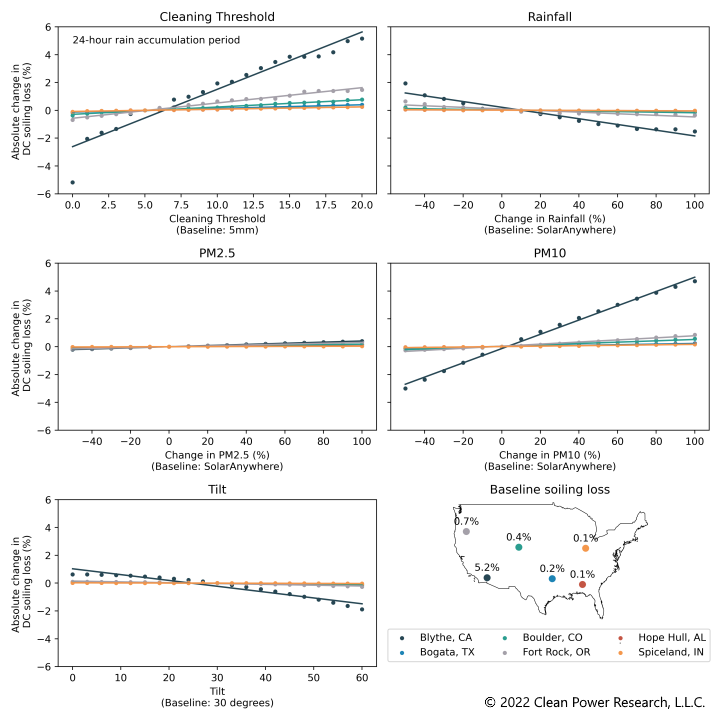
To understand how soiling loss estimates are affected by different input parameters, a sensitivity analysis of soiling estimates was conducted for an arbitrary fixed-tilt PV system placed at 5 different locations in the U.S. Figure 1 shows the sensitivity of soiling losses to various input parameters.
The sites are classified into low and high soiling sites based on an NREL study, wherein a site is considered to be a low-soiling site if average annual soiling losses at the site are <1% (or soiling ratio >0.99). It is found that sites with high soiling losses are highly sensitive to input data and model parameters such as PM10 and cleaning threshold. If a location is identified as a high soiling site with the HSU model, further due diligence such as on-site soiling loss measurements may be necessary to accurately quantify PV production loss due to soiling.
Figure 1: Sensitivity of HSU Model Soiling Losses to Input Parameters
The Kimber soiling model uses a defined rate of soiling that accumulates daily. Rainfall and manual washes can reset the soiling to zero. When rainfall accumulates such that a cleaning event occurs, there is a grace period after which soiling does not accumulate. Additionally, an initial soiling and max soiling value can be set. The complete list of input parameters used in the Kimber model and their default values are listed in Table 2.
Table 2: Kimber soiling loss model parameters
| Parameter | Definition | Default Value in pvlib | Can be specified by the user |
|---|---|---|---|
| cleaning_threshold | Amount of rain in an accumulation period needed to clean the PV modules. [mm] | 6 | Yes |
| soiling_loss_rate | Fraction of energy lost due to one day of soiling. [Unitless] | 0.0015 | Yes |
| grace_period | Number of days after a rainfall event when it’s assumed the ground is damp, and so it’s assumed there is no soiling. [Days] | 14 | Yes |
| max_soiling | Maximum fraction of energy lost due to soiling. Soiling will build up until this value. [Unitless] | 0.3 | Yes |
| manual_wash_dates | The number of times the PV modules are cleaned during the month. Cleanings are assumed to be roughly evenly spaced. Expressed as a sequence of 12 integers. | 0,0,0,0,0,0,0,0,0,0,0,0 | Yes |
| initial_soiling | Initial fraction of energy lost due to soiling at beginning simulation. [Unitless] | 0 | Yes |
| rain_accum_period | The period for which rain accumulates up defined threshold before cleaning occurs. [Hours] | 24 | Yes |
Applications and known limitations of soiling loss data
Global, on-demand access to soiling loss estimates enables solar developers and owners to easily identify project locations with increased soiling risk. This can help determine if further due diligence, such as installation of on-site soiling stations, is necessary to accurately quantify potential PV generation risk. Additionally, long-term monthly soiling loss averages (e.g., 12×1) can be used with energy modeling programs such as PVSyst and PlantPredict to make PV production estimates more site specific and data driven. The SolarAnywhere API makes it easy to model and compare soiling losses for different system configurations. This can be useful for optimizing system design and maximizing PV performance and project revenue.
To illustrate the value of these global modeling capabilities, we generated a global soiling loss map using the HSU soiling loss model and SolarAnywhere historical time-series weather data from 2006-2020. An arbitrary utility-scale (50MWdc) fixed-tilt PV system was considered for this analysis. Natural precipitation is used as the sole source of dust removal in the HSU model. On-demand, global access to PM10 and PM2.5 particulate matter data in SolarAnywhere could support the development and evaluation of other soiling models as they become available.
The map in Figure 2 shows that for panels that are not cleaned manually, soiling losses can reach as high as 35% in northern Africa and the Middle East. This is due to the prevalence of high particulate matter (such as dust and sand) and low precipitation in the area. This trend is confirmed in a study by Li et al that reported capacity factor reduction of more than 30% in the Middle Eastern and Saharan regions, despite their abundance of available solar resource.
Figure 2: Global Soiling Loss Map Based on SolarAnywhere Data and HSU Soiling Model
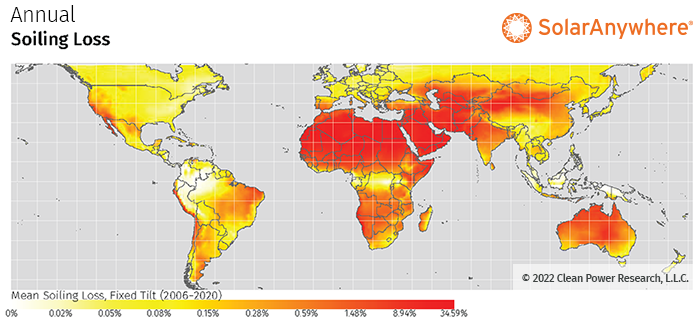
Annual Mean Soiling Loss (2006-2020); Fixed-tilt PV System
SolarAnywhere uses industry-leading methods to generate soiling loss estimates. However, users should note the limitations of modeled soiling data, and how the data compares with ground-based measurements:
- Soiling losses provided by SolarAnywhere represent atmospheric or regional soiling. Actual soiling losses may vary significantly—even within a single PV plant—due to highly location-specific conditions, such as particulates from nearby agricultural activity or trees.
- In general, careful ground-based soiling loss measurements, if available, are preferred for solar project financing. While precise, measured data is an important reference for understanding soiling losses, the long history available with modeled data can enable solar asset owners to put recent measurements in a historical context. For example, was the project site impacted by a regional soiling event such as a large wildfire or dust storm recently? Or was the soiling a site-specific phenomenon? Knowing the difference between a one-off event and a soiling-prone site means that stakeholders can more-effectively plan for and mitigate the issue.
- The authors of the HSU model validated the model against measured soiling data at seven locations across the U.S. and found that the model accurately predicts soiling losses at the comparison sites.2 Another study by Micheli et al. performed model validation using ground measured data from six measurement sites spread across the U.S. It was found that the HSU model with these settling velocities consistently returned the lowest errors, with minimum mean absolute errors (MAE) and mean errors (ME) close to zero. Additionally, the study found that errors in soiling modeling are similar when satellite-derived or ground-measured particulate matter data are used.3
- Certain parameters such as the cleaning_threshold can vary from site to site, and can affect the accuracy of soiling loss estimates for high-soiling sites (as shown in Figure 1 above). Previous studies have found that 0.2 in (5mm) of rainfall is sufficient to clean photovoltaic systems.4 However, in a study by Kimber et al., it was found that some systems may require significantly more rainfall to completely clean the PV panels.5
- Potential values for the cleaning threshold parameter based on different climatology are also provided in a study by Bessa et al.6 This information may also be inferred from the generation of operating assets or ground-measured data to better tune the soiling loss model to site-specific conditions.
SolarAnywhere time-series simulations are available with time-series data licenses including Sites and SystemCheck®. Additionally, average monthly snow and soiling loss estimates can be accessed on-demand for any project location across the world via the SolarAnywhere data website. Contact us to learn more about SolarAnywhere licensing options.
References
1 Particulate matter 10 micrometers or less and 2.5 micrometers or less, respectively.
2 Coello M, Boyle L. 2019. Simple Model for Predicting Time Series Soiling of Photovoltaic Panels. IEEE Journal of Photovoltaics, Volume 9: Issue 5: 1382-1387. DOI: 10.1109/JPHOTOV.2019.2919628. Link
3 Micheli L, Smestad G. P., Bessa J G, Muller M, Fernandez E F, Almonacid F. 2021. Tracking Soiling Losses: Assessment, Uncertainty, and Challenges in Mapping. IEEE Journal of Photovoltaics, Volume 12, Issue 1: 114-118. DOI: 10.1109/JPHOTOV.2021.3113858. Link
4 Hamond R, Srinivasan D, Harris A, Whitfield K, Wohlgemuth J. 1997. Effects of Soiling on PV Module and Radiometer Performance. 26th IEEE PVSC, September 29 – October 3, 1997. Link
5 Kimber A, Mitchell L, Nogradi S, Wenger H. 2006. The Effect of Soiling on Large Grid-Connected Photovoltaic Systems in California and the Southwest Region of the United States. 2006 IEEE 4th World Conference on Photovoltaic Energy Conference, May 7-12, 2006. DOI: 10.1109/WCPEC.2006.279690. Link
6 Bessa J, Micheli L, Almonacid F, Fernandez E F. 2021. Monitoring photovoltaic soiling: assessment, challenges, and perspectives of current and potential strategies. iScience, Volume 24, Issue 3. https://doi.org/10.1016/j.isci.2021.102165. Link