
This page contains a complete list of the irradiance and weather data fields available from SolarAnywhere®. SolarAnywhere generates irradiance data using proprietary models. Remaining data fields are pulled from weather data providers such as NOAA and NASA.
If you’d like to learn about SolarAnywhere weather-data field sources, visit Weather Data Sources
Global Horizontal Irradiance (GHI)
Global horizontal irradiance is the total solar radiation per unit area measured at a horizontal surface on the earth. It is typically presented in W/m2 and can be broken down into two components: direct normal irradiance (DNI) and diffuse horizontal irradiance (DHI). The relationship between GHI, DHI and DNI is expressed in the equation below:
GHI=DHI+DNI*cos (α_{zenith} )
Units: W/m2
Direct Normal Irradiance (DNI)
Direct normal irradiance (DNI) is the portion of solar radiation that reaches the earth on a direct path from the sun.
Units: W/m2

Diffuse Horizontal Irradiance (DIF or DHI)
Diffuse horizontal irradiance (DIF or DHI) is the portion of solar radiation that reaches the earth indirectly. Water vapor, aerosols and clouds reflect and absorb solar radiation, diffusing it throughout the atmosphere.
Units: W/m2
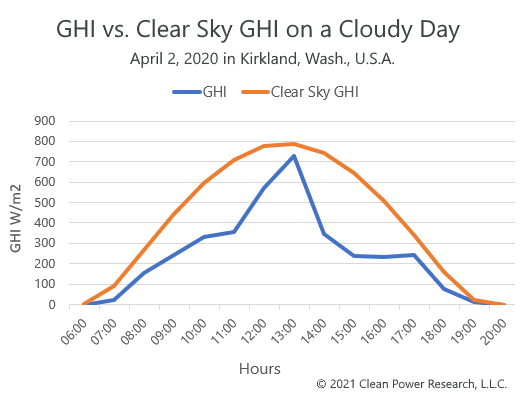
Clear-Sky Irradiance
Irradiance calculated prior to taking cloud cover into consideration. Clear-sky irradiance is calculated based on solar geometry, elevation, water vapor, ozone, albedo, and aerosol optical depth.
Clear-sky irradiance data is helpful when using solar resource data to analyze PV system performance. It helps in differentiating between cloudy conditions and other circumstances that may be affecting plant performance, such as equipment failure or losses due to snow cover or soiling.
Units: W/m2
Snow Depth
A measurement of accumulated snow height on the ground. Snow-depth data is helpful in estimating PV system losses due to snow accumulation on modules. Visit Snow Loss Modeling to learn about effective methods for estimating snow losses.
Data is available in all geographic regions. In SolarAnywhere versions 3.8 – current, snow-depth measurements globally are received at an hourly resolution. In SolarAnywhere versions 3.4 – 3.7, snow-depth measurements are received daily and persisted for every observation until the next measurement is received. Visit Weather Data Sources for information on SolarAnywhere snow-depth data sources.
Snow depth can be requested as an output field with time-series, typical-year (TGY/TDY/average year) and probability of exceedance data types. Note that typical year and probability of exceedance data files are generated with 100% weighting on the irradiance component and such the snow depth data included in these files is not necessarily representative of the average or PXX snow depth.
Units: m
Solid and Liquid Precipitation
The total solid and liquid precipitation that fell per meter squared. Precipitation data is often used as a key input in PV soiling loss models, such as the HSU and Kimber models, since rainfall events can remove accumulated dirt, ash, etc., from PV modules.
Data is available in all geographic regions. In SolarAnywhere versions 3.8 – current, precipitation measurements globally are received at an hourly resolution. Sub-hourly measurements are calculated by a linear interpolation of the hourly rates. In SolarAnywhere versions 3.4 – 3.7, precipitation measurements are received as daily totals that are then divided by the number of observations included in each day (varies based on requested temporal resolution). Visit Weather Data Sources for information on SolarAnywhere precipitation data sources.
Precipitation can be requested as an output field with time-series, typical-year (TGY/TDY/average year) and probability of exceedance data types. Note that typical year and probability of exceedance data files are generated with 100% weighting on the irradiance component and such the precipitation data included in these files is not necessarily representative of the average or PXX precipitation.
Units: kg/m2
Ambient Temperature
Air temperature measured at a height of 2-meters. Ambient temperature is an important consideration in PV performance modeling as temperature affects the performance of PV modules and inverters. PV modules and inverters often demonstrate reduced performance in extreme temperatures.
Data is available in all geographic regions and can be requested as an output field with time-series, typical-year (TGY/TDY/average year) and probability of exceedance data types. Visit Weather Data Sources for information on SolarAnywhere ambient temperature data sources.
Units: Degrees Celsius
Wind Speed
The wind speed measured at a height of 10-meters or 100-meters. Wind speed is often considered in PV performance modeling since it can have a cooling effect on PV cell temperature. Cooling can improve PV module performance during periods of high ambient temperature.
Data is available in all geographic regions and can be requested as an output field with time-series, typical-year (TGY/TDY/average year) and probability of exceedance data types. Visit Weather Data Sources for information on SolarAnywhere wind speed data sources. Wind speed at 100 meters is limited to SolarAnywhere versions 3.8 and later and is not currently available for real-time or forecast time periods. Visit Wind In-depth for additional information on wind datasets.
Units: m/s
Wind Direction
The direction the wind is coming from measured at a height of 10- or 100-meters in degrees clockwise from north with a range of 0 to 359 degrees. Wind direction is often considered in PV performance modeling to minimize shading impacts through optimal panel placement. Additionally, wind direction data may provide insight into PV system performance due to wind-induced temperature variations and cooling impacts.
Data is available in all geographic regions and can be requested as an output field with time-series, typical-year (TGY/TDY/average year) and probability-of-exceedance data types. Visit Weather Data Sources for information on SolarAnywhere wind direction data sources. Wind direction data is limited to SolarAnywhere versions 3.8 and later and is not currently available for real-time or forecast time periods. Visit Wind In-depth for additional information on wind datasets.
Units: Degrees
Wind Gust
The maximum wind speed measured over 3-second intervals at a height of 10-meters for a given period. In PV performance modeling, wind gust data is beneficial for assessing the risk of damage from storms and inclement weather.
Data is available in all geographic regions and can be requested as an output field with time-series, typical-year (TGY/TDY/average year) and probability-of-exceedance data types. Visit Weather Data Sources for information on SolarAnywhere wind direction data sources. Wind gust data is limited to SolarAnywhere versions 3.8 and later and is not currently available for real-time or forecast time periods. Visit Wind In-depth for additional information on wind datasets.
Units: m/s
Relative Humidity
Relative humidity is a measure of the moisture content of the air at the ambient temperature. Relative humidity is often used in PV performance modeling to estimate the precipitable water content of the air, which can be used in conjunction with air mass to apply spectral correction factors. The spectral composition of the solar irradiance reaching PV modules has been shown to impact system performance.1
Data is available in all geographic regions and can be requested as an output field with time-series, typical-year (TGY/TDY/average year) and probability of exceedance data types. Visit Weather Data Sources for information on SolarAnywhere relative humidity data sources.
Units: %
Albedo
Albedo is a measure of the fraction of the global horizontal irradiance that is reflected off the ground. Visit Albedo Support for a detailed write-up on SolarAnywhere albedo data.
SolarAnywhere albedo data takes snow conditions into consideration. Snow conditions are highly variable from year to year. Because of this, we recommend utilizing the 12 monthly long-term averages presented in the average year summary file for use in PV performance modeling, rather than the albedo data presented in typical year files. Typical year files are generated with 100% weighting on the irradiance component. For example, the January data selected for the typical year file might be from January of 2002 because it is the most representative of typical irradiance conditions, but January of 2002 may have experienced lower than average snowfall which would be reflected in the albedo data.
Visit Average Year Summary to see additional information about this file type and see how to utilize the average albedo values in PV modeling.
Data is available in all geographic regions and can be requested as an output field with time-series, typical-year (TGY/TDY/average year) and probability of exceedance data types. Albedo data is limited to SolarAnywhere versions 3.5 and later and is not currently available for forecast time periods.
Units: Unitless
Particulate Matter
Particulate matter—also known as particle pollution or PM—is a mixture of small particles and liquid droplets suspended in the air. Particulate matter data has been shown to be highly correlated with soiling losses and has been incorporated by PV simulation models such as the Humboldt State University (HSU) model to estimate soiling losses. Particulate matter may include dust, dirt, soot and smoke, as well as other organic and inorganic compounds. Depending on the size of the particles, particulate matter can be categorized into:
- Particles with diameter less than or equal to 10 micrometers, known as PM10
- Particles with diameter less than or equal to 2.5 micrometers, known as PM2.5
Data is available in all geographic regions and can be requested as an output field with time-series, typical-year (TGY/TDY/average year) and probability of exceedance data types. Particulate matter data is limited to SolarAnywhere versions 3.5 and later and is available globally for historical, real-time and forecast (2 days ahead) time periods. Visit the particulate matter page to learn more about SolarAnywhere particulate matter.
Units: μg/m3.
Irradiance Observation Type
The irradiance observation type refers to a two-character code used to indicate two things:
- The model (historical, real-time or forecast) used in generating the irradiance value
- Whether the value was observed, missing, estimated or filled with a long-term average
Visit Missing Data to learn more.
The first character indicates the model used to generate the irradiance value or if the user is not licensed for a portion of the requested date range:
| F | Forecast | The forecast model was used to generate the irradiance values. |
| M | Month | The real-time model was used to generate the irradiance values. “Month” is short for “current month” in reference to a portion of the period for which the real-time model is used. |
| A | Archive | The historical model was used to generate the irradiance value. Data generated using the historical model is archived, meaning data downloaded for a certain location will never change in future downloads at that location (if requesting within the same data version). |
| U | Unlicensed | The user requesting the data is not licensed for these irradiance observations. |
The second character indicates whether the value was observed, missing, estimated, or filled with a long-term average:
| D | Day | Observed daytime irradiance values. |
| N | Night | Nighttime observation time, irradiance values will equal 0. |
| M | Missing | Visit Missing Data for more information. |
| F | Filled | Irradiance values filled with a long-term average irradiance value. Visit Missing Data for more information. |
| E | Estimated | Irradiance values generated from surrounding values when data is missing for short periods (less than 4 consecutive hours). |
| S | Short range estimate | Forecast values for short range up to 7 days ahead based on a blend of NWP models. |
| L | Long range estimate | Forecast values beyond 7 days ahead. |
| 1 | 1-Minute estimate | Advanced forecast values, generally from 1-minute up to 5-hours ahead based on the satellite cloud motion vector approach. |
Examples:
| AD | A daytime irradiance value generated using the historical model. |
| MD | A daytime irradiance value generated using the real time model. |
| AF | A daytime irradiance value during a historical data period of missing satellite data, filled with long term averages. |
Wind and Ambient Temperature Observation Type
SolarAnywhere provides ambient temperature and wind (wind speed, wind gust and wind direction) data from global reanalysis models. Periods of missing data can occur due to periods of missing measurements from ground-based sensor networks.
The wind and ambient temperature observation types provide a one-letter code indicating if the weather data was observed, missing or filled with long term averages. Users can specify whether they would like SolarAnywhere to fill missing data periods with long-term climatological averages, leave them blank, or fill them with integer or text strings that make them easier to sift out.
Here are the codes that can be provided as wind speed or ambient temperature observation types.
| O | Observed | |
| M | Missing | |
| F | Filled | With long term averages, visit Missing Data to learn more about this option. |
| U | Unlicensed | The user requesting the data is not licensed for these irradiance observations. |
References
1 Nelson L, Frichtl M, Panchula A. 2013. Changes in Cadmium Telluride Photovoltaic Performance Due to Spectrum. IEEE Journal of Photovoltaics. 3(1):488-493. DOI: 10.1109/JPHOTOV.2012.2226868. Link