
What is MeteoLens?
MeteoLens™ is a per-location upgrade license that provides access to specialized climate and atmospheric datasets—including Climate Projections, Smoke Impact data, and Extended History. These datasets extend SolarAnywhere beyond standard historical analysis, enabling deeper insight into long-term variability, extreme-weather impacts, and climate-driven risk for solar performance and planning.
MeteoLens Data Access
MeteoLens datasets are available for download exclusively via the SolarAnywhere Data Portal.
Access to MeteoLens requires an active Typical Year, Typical Year+, or Sites license. SolarAnywhere Historical Data users can add MeteoLens as a per-location upgrade at any active site, unlocking MeteoLens datasets for that location.
Upgrading a Location to MeteoLens
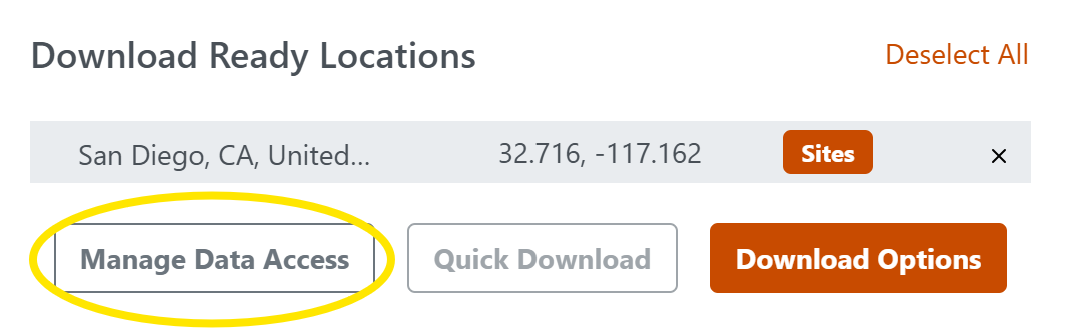
- Select an active location (Typical Year, Typical Year+ or Sites) from the Location List, and choose Manage Data Access:
- Click the + button under License Upgrades:
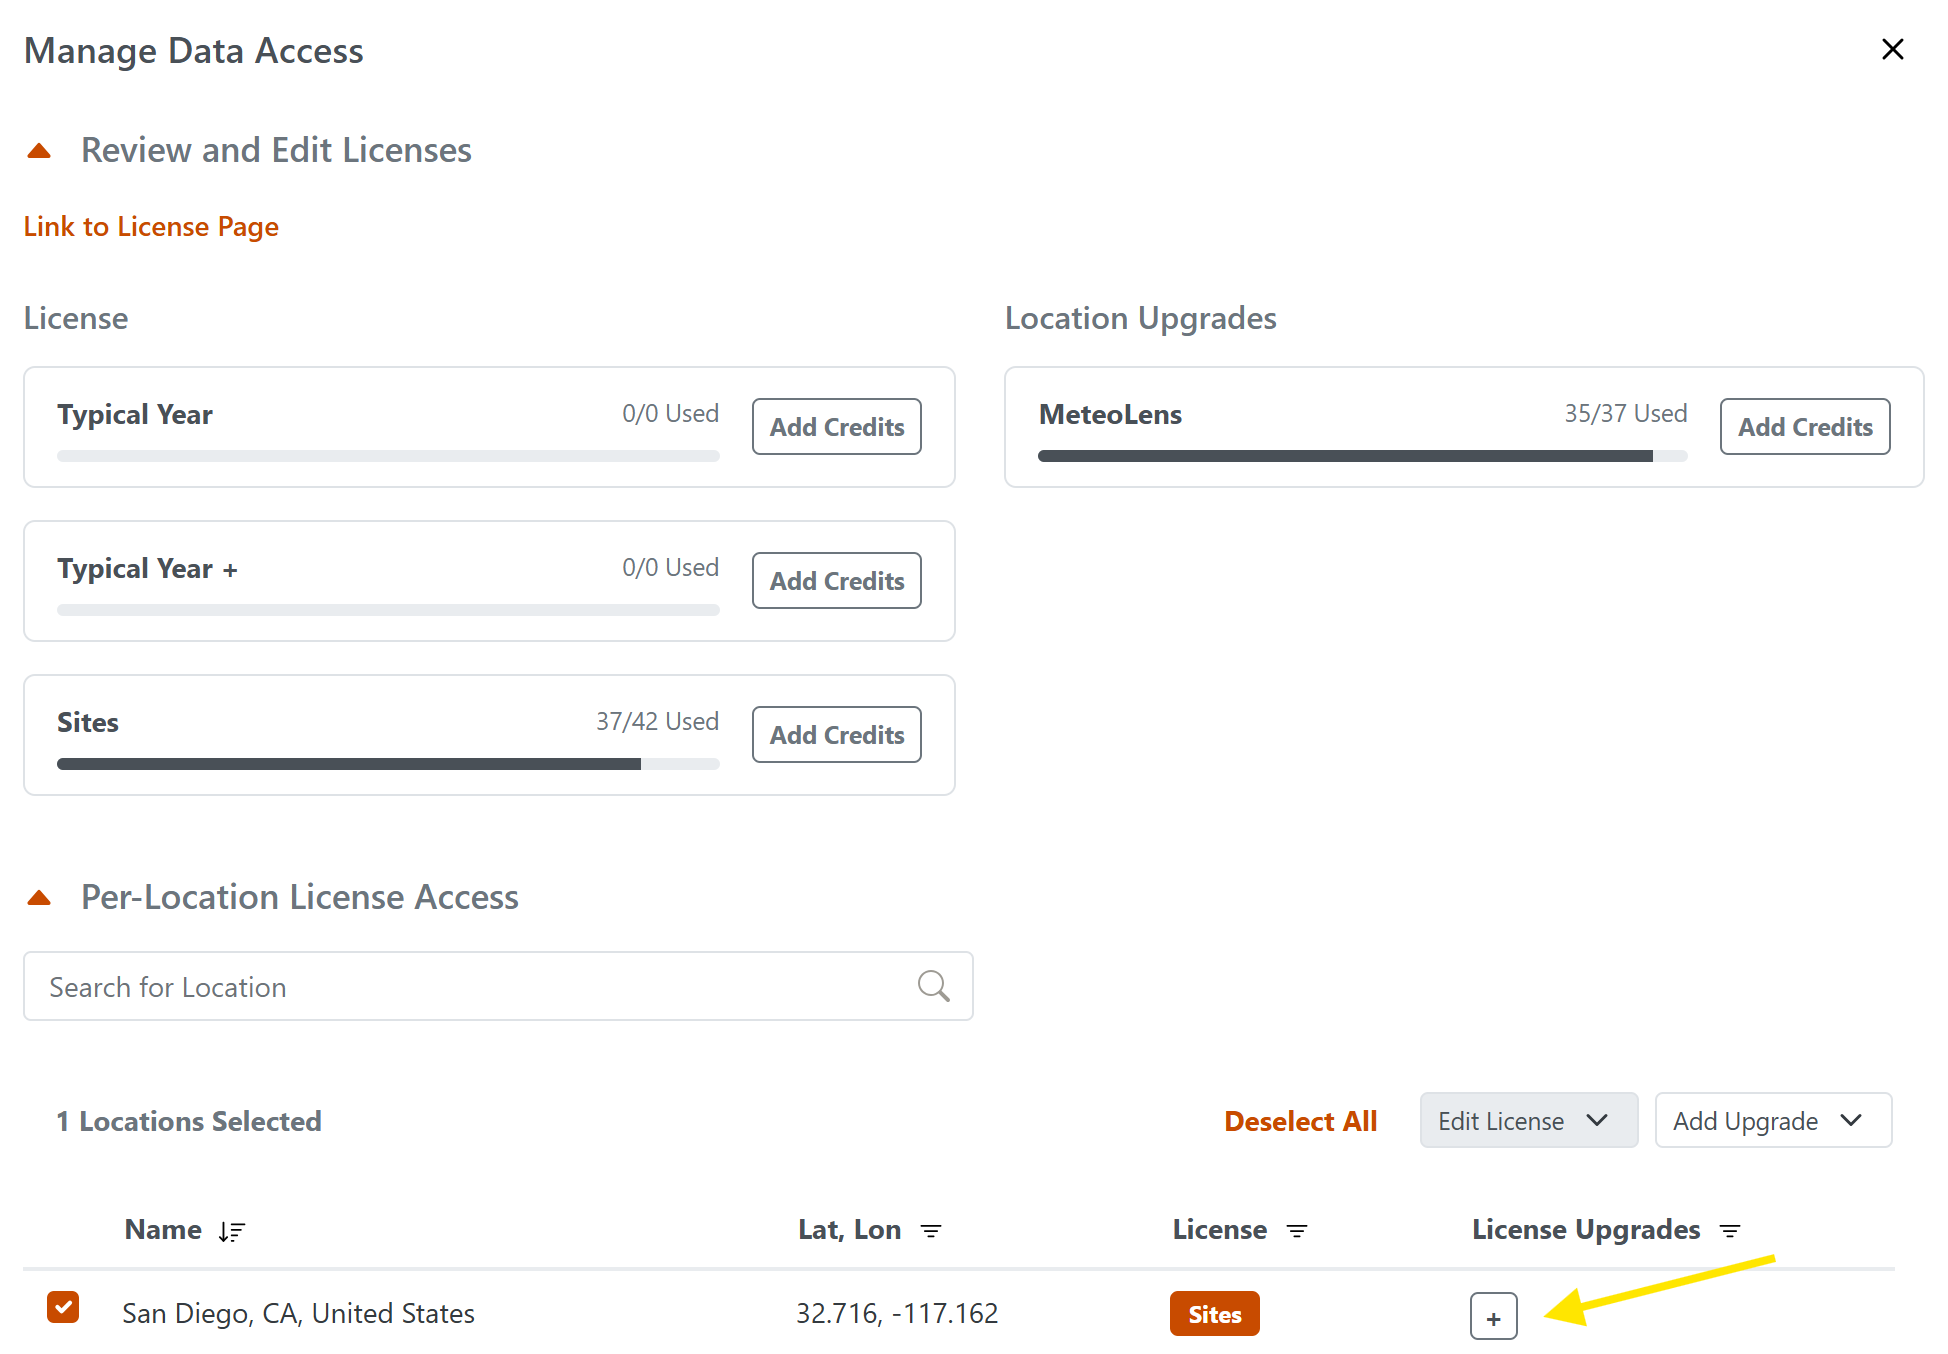 Note: If no MeteoLens location upgrade credits are available, click Add Credits in the Review and Edit Licenses section of the Manage Data Access window. MeteoLens credits can be purchased directly from the SolarAnywhere website by following the prompts on the purchase page.
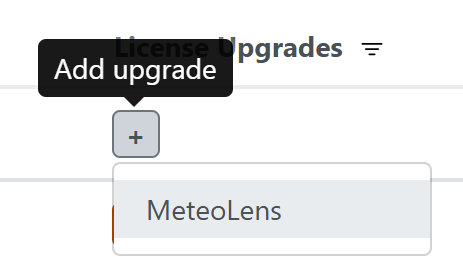
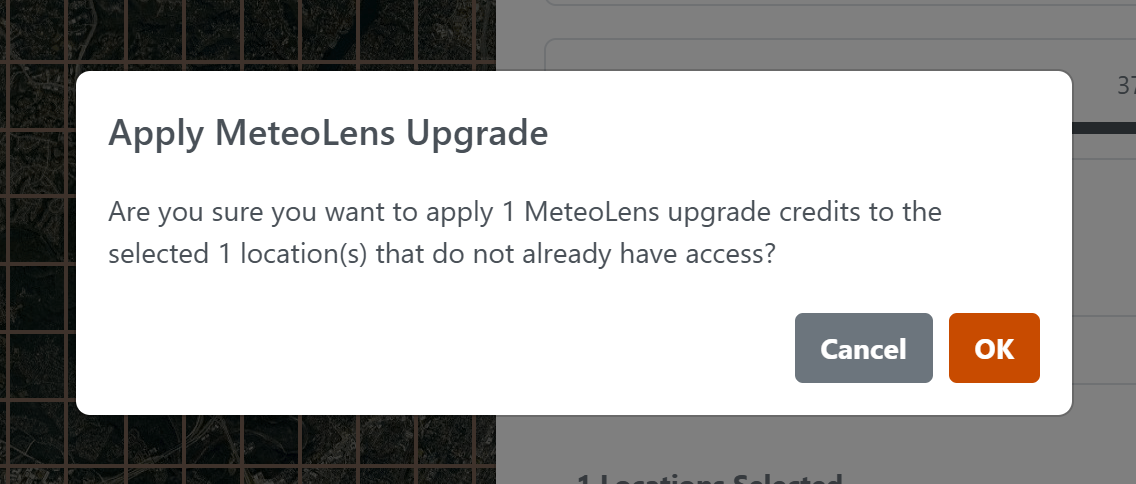
 - Select MeteoLens and confirm.
MeteoLens – Climate Projections Data
MeteoLens Climate Projections provides location-specific solar resource and weather projections through 2099. These datasets are designed to support long-term planning, climate risk assessment, and scenario-based portfolio analysis. The projections are based on outputs from the Max Planck Institute Earth System Model (MPI-ESM1.2), and are processed using Clean Power Research methodologies to produce variables relevant for solar energy analysis.
The datasets enable users to evaluate potential changes in solar irradiance, temperature, and other meteorological variables under different future climate conditions. This supports applications such as energy yield forecasting, financial modeling, and risk-informed project development.
Climate Scenarios (CMIP6 / SSP Framework)
When downloading projection data, users select a climate scenario representing a specific future pathway. These scenarios follow the Shared Socioeconomic Pathways (SSPs) defined by the CMIP6 framework. Each scenario reflects different assumptions about global development, greenhouse gas emissions, and land use.
The scenario naming convention (e.g., SSP1-2.6, SSP2-4.5, SSP5-8.5) refers to the approximate level of radiative forcing (in W/m²) reached by 2100 relative to pre-industrial conditions. Radiative forcing represents the net change in Earth’s energy balance, defined as incoming solar radiation minus outgoing terrestrial radiation. Higher values generally correspond to greater warming.
A summary of available scenarios is provided in Table 1.
Table 1. Shared Socioeconomic Pathways1
| SSP Scenario | Name | Description | End of century CO2 ppm |
|---|---|---|---|
| SSP1 - 2.6 | “Sustainability - Taking the Green Road” | Rapid global cooperation, low population growth, and aggressive emissions reductions, resulting in limited warming. | ~390 |
| SSP2 – 4.5 | “Middle of the Road” | Continuation of current socioeconomic and policy trends, with moderate emissions growth and later stabilization. | |
| SSP3 – 7.0 | “Regional Rivalry – A Rocky Road” | Fragmented global development and limited climate policy, leading to higher emissions and increased warming. | |
| SSP5 – 8.4 | “Fossil-Fueled Development – Taking the Highway” | Energy-intensive economic growth dominated by fossil fuels, resulting in very high emissions and strong climate forcing. | ~1130 |
Data Structure and Formats
MeteoLens Climate Projection data is available in several formats to support different analysis workflows:
- Hourly Time Series (Downscaled): Continuous hourly datasets derived from daily climate model outputs using CPR downscaling techniques. These are suitable for detailed simulation and performance modeling workflows.
- Monthly and Annual Aggregations: Pre-aggregated summaries for long-term trend analysis, scenario comparison, and reporting purposes.
- Temperature-Weighted Typical Year (8760): A representative 8760-hour dataset constructed from projection data to reflect temperature-driven variability over the selected future period and scenario. These files can be imported into tools such as PVsyst in a manner similar to SolarAnywhere Typical Year datasets.
Spatial and Temporal Resolution
- Spatial resolution: Approximately 100 km
- Temporal coverage: Data is available at hourly, daily, and annual intervals, covering the period from 2015 through 2099.
The spatial resolution (~100 km) reflects the native scale of the underlying climate model, which is optimized for capturing large-scale climate trends rather than site-level variability.
Hourly datasets are derived from the model’s native daily outputs using Clean Power Research’s AI-based statistical downscaling methods. This approach redistributes daily values into realistic hourly profiles while preserving key physical characteristics of the underlying data.
For solar irradiance (GHI), the downscaled hourly values are energy-conserving, meaning that the sum of the 24 hourly values for a given day equals the original daily total from the MPI-ESM1.2 model.
For other meteorological variables, hourly values are generated using a random forest–based approach. As a result, daily totals derived from aggregating hourly values may not exactly match the original model outputs on a day-to-day basis. However, consistency is maintained over longer time horizons, and aggregated values (e.g., annual totals) align with the underlying climate model at a macro level.
Conceptual Example
The below figure example illustrates how climate projections vary across different CMIP6 scenarios (SSPs), showing a range of possible long-term temperature trajectories under different emissions pathways. Each line represents a different scenario, with dashed lines indicating long-term trends and solid lines showing year-to-year variability.

Figure 1: Projected annual maximum air temperature by CMIP6 scenario (SSP), Mojave Desert (2025–2099).
How to interpret this figure:
- The figure should be viewed as a comparison of scenarios, not a prediction of a single future outcome.
- Differences between scenarios reflect alternative long-term climate pathways, rather than site-specific forecasts.
- Year-to-year variability remains present, even within long-term trends.
- These projections help support sensitivity analysis and risk assessment.
Important Context
- Climate projections represent plausible future conditions, not deterministic forecasts.
- Results are derived from a global climate model and reflect scenario assumptions, not site-adapted outcomes.
- Data is best used to understand ranges of potential impact (e.g., temperature derates, long-term variability), rather than to predict specific values in a given year.
Downloading Climate Projections Datasets
- Choose a MeteoLens location from the Location List, and it will populate in the Download Ready Locations section.
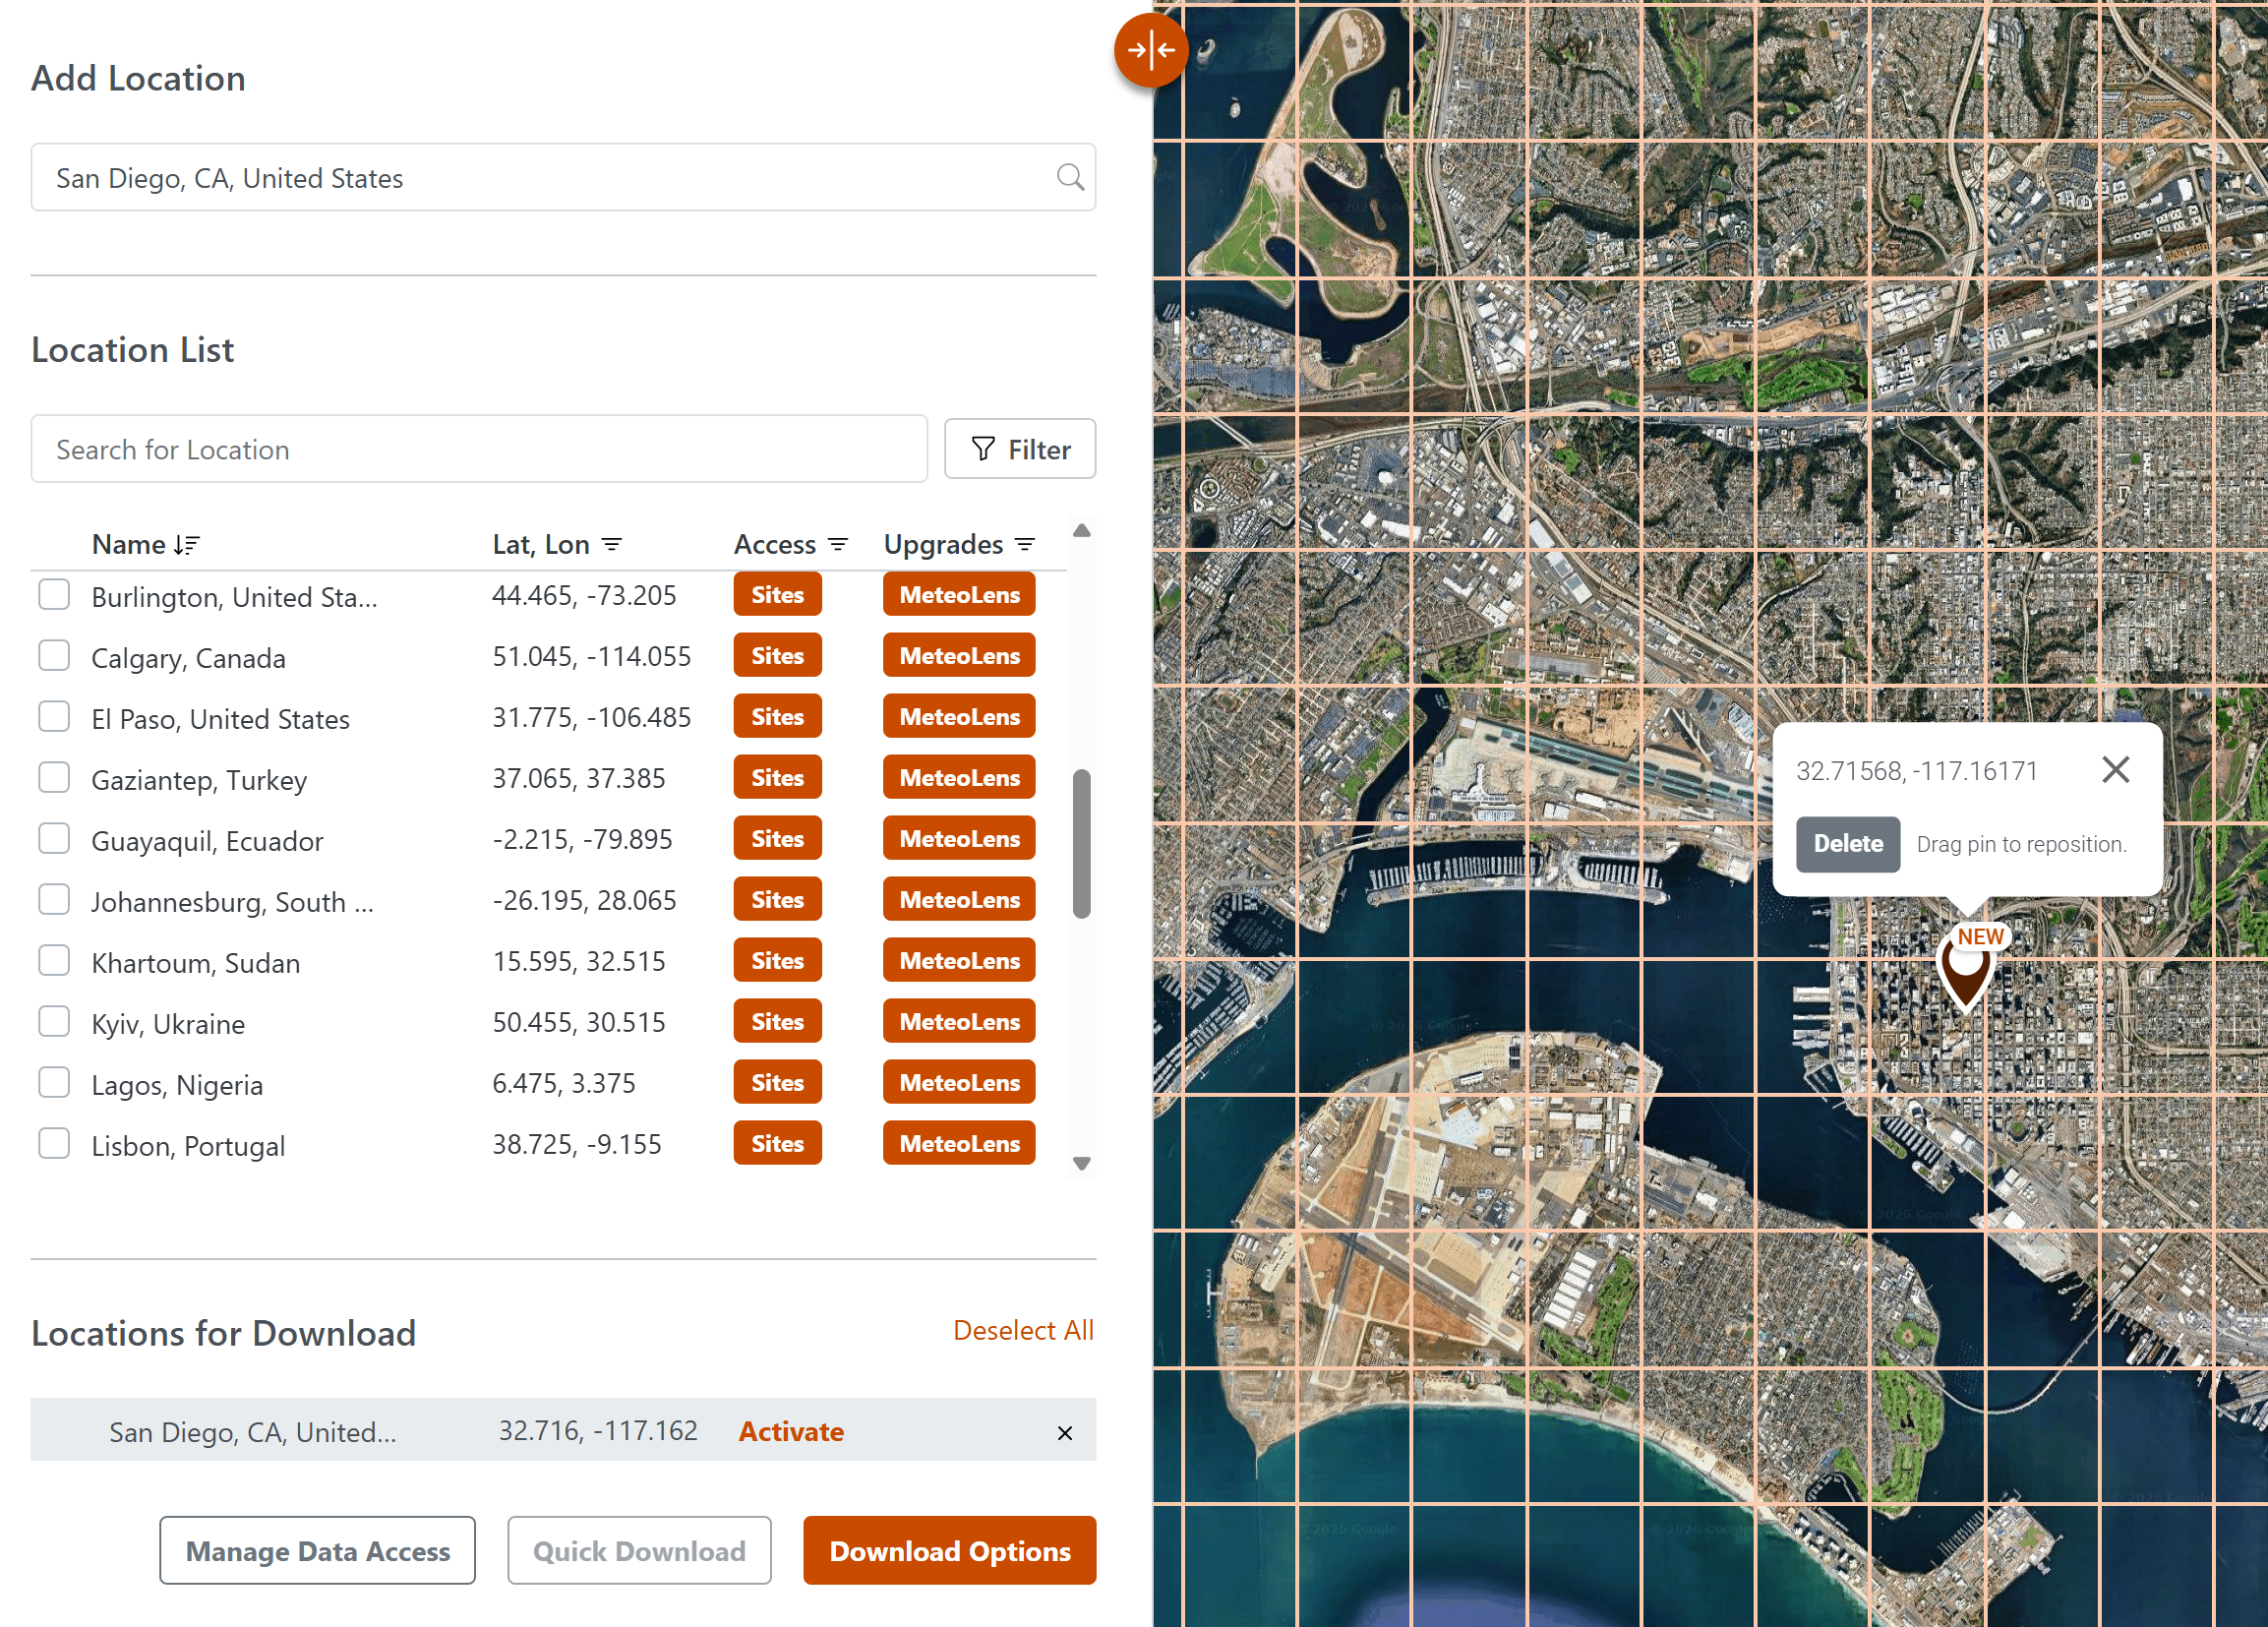
- Select Download Options.
- In the download window, choose Climate Projections Data and specify the date range you would like reflected in the files, Climate Scenario, File Type(s), and Datasets.
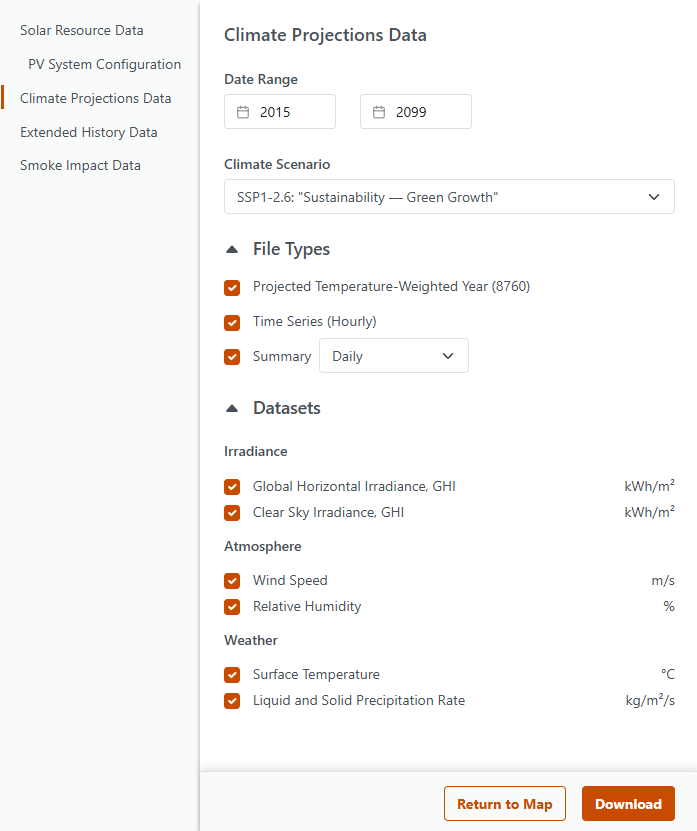
- Click Download, and then download the data from the Files tab.
MeteoLens – Smoke Impact Data
In recent years, wildfire activity has increased in both frequency and intensity in many regions, creating measurable impacts on solar resource availability. MeteoLens Smoke Impact Data is designed to quantify the effect of wildfire smoke on solar irradiance, enabling more accurate performance analysis and improved attribution of energy losses during smoke-affected periods.
Smoke impact datasets are available globally for the historical period from 1998 through 2025. When used alongside standard SolarAnywhere historical time series data (i.e., with a Sites license), these datasets allow users to distinguish between observed irradiance conditions and estimated smoke-free conditions for the same location and time period.
Dataset Overview
MeteoLens Smoke Impact Data provides hourly estimates of the incremental effect of wildfire smoke on irradiance, rather than full irradiance time series.
The dataset includes two fields:
- Smoke Impact on Global Horizontal Irradiance (GHI) (W/m²)
- Smoke Impact on Direct Normal Irradiance (DNI) (W/m²)
These fields represent the additional irradiance that would have been available in the absence of wildfire smoke under the same atmospheric conditions.
SolarAnywhere historical irradiance data (available via a Typical Year, Typical Year+ and Sites license) already reflects real-world conditions, including the impact of smoke, as the underlying models dynamically account for aerosol optical depth (i.e., atmospheric particulates). The smoke impact fields are designed to be used in combination with this data.
By adding the smoke impact values to the corresponding timestamps in the SolarAnywhere irradiance time series (available via a Sites license) users can estimate counterfactual smoke-free irradiance conditions. The difference between the observed irradiance and the reconstructed smoke-free irradiance represents the reduction in available solar resource attributable to wildfire smoke.
How the Data Can Be Used
When paired with SolarAnywhere historical time series datasets (available via a Sites license), smoke impact data enables a range of analytical workflows:
- Performance Attribution: Identify whether periods of reduced system output are driven by wildfire smoke versus other factors such as system issues or weather variability.
- Energy Loss Quantification: Estimate the magnitude of irradiance and production losses attributable to smoke events on an hourly, daily, or aggregated basis.
- Historical Event Analysis: Evaluate the impact of major wildfire events on individual sites or across portfolios.
- Portfolio Risk Assessment: Analyze historical exposure to smoke-related impacts to inform future siting and risk management strategies.
Conceptual Example
The figure below illustrates this relationship:
- The solid line shows observed irradiance, which includes the effects of wildfire smoke.
- The dashed line shows the reconstructed smoke-free irradiance, derived by adding the smoke impact values to the observed data.
- The gap between the two curves represents the quantified reduction in solar resource due to smoke.
This approach enables direct, time-aligned comparisons and supports more accurate attribution of performance impacts during smoke-affected periods.

Figure 2: Impact of Wildfire Smoke on Solar Irradiance — Observed vs. Estimated Smoke‑Free Conditions (Alberta, July 2023)
Data Availability and Access
- Temporal resolution: Hourly
- Coverage period: January 1998 through December 2025
- Geographic coverage: Global (60°N to 60°S)
Smoke impact data can be downloaded from the SolarAnywhere Data Services interface for MeteoLens-enabled locations.
Methodology and References
The methodology underlying MeteoLens Smoke Impact Data builds on Clean Power Research’s published research on quantifying aerosol- and smoke-related impacts on solar irradiance. This includes peer-reviewed studies such as Quantifying the Solar Impacts of Wildfire Smoke in Western North America (2021)2 and Quantifying the Effects of the 2023 Canada Wildfires on Surface Solar Irradiance (2025)3.
Download Smoke Impact Data Sample (CSV File)Downloading Smoke History Datasets
- Choose a MeteoLens location from the Location List, and it will populate in the Download Ready Locations section.
- Select Download Options.
- In the download window, choose Smoke Impact Data and specify the date range.
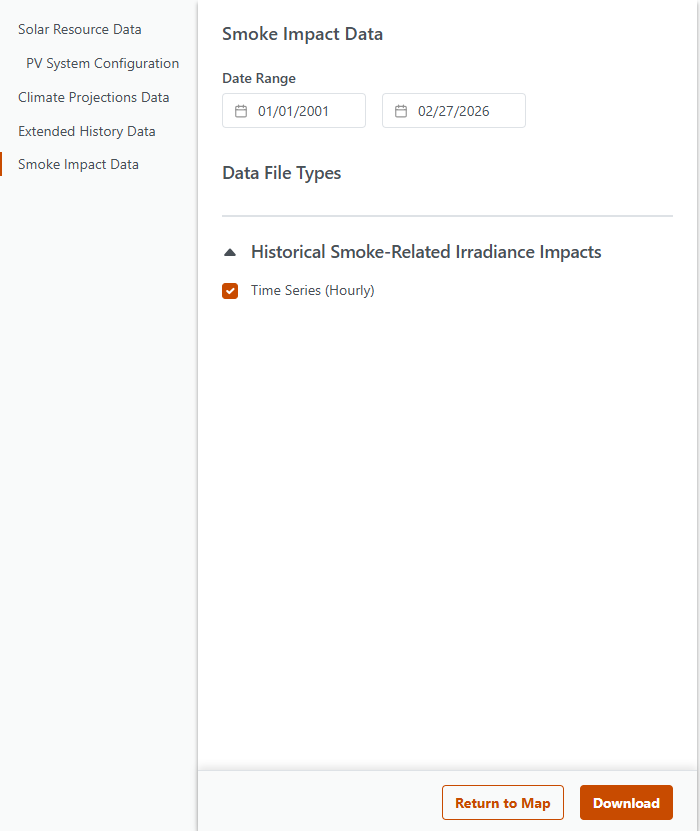
- Click Download and retrieve the data from the Files page.
MeteoLens – Extended History Data
MeteoLens Extended History datasets provide long-term, multi-decade summaries of key solar and weather variables to support trend analysis, portfolio screening, and climate context assessments.
These datasets include annual and monthly summary files for solar irradiance, surface temperature, liquid precipitation, and wind gusts, with coverage extending back to 1960. By using summarized rollups rather than raw time-series data, users can more easily identify multi-year trends, interannual variability, seasonal patterns, and extreme conditions across regions and time periods.
Data Overview
| Available Datasets | Data Period | Data Source | Resolution | Coverage | Format |
|---|---|---|---|---|---|
| Insolation/Irradiance, Surface Temperature, Liquid Precipitation, Wind Gust | 1960 – last full year at time of data version release | Reanalysis Model | 25-km, 60-min | All Regions | Annual or monthly summary file |
Important Context
Extended History datasets are designed to provide broad climatological context, rather than site-specific, bankable irradiance estimates.
- Data is derived from a global reanalysis model, ensuring consistency across decades.
- Results reflect modeled historical conditions, not measured or site-adapted data.
- These datasets are best suited for long-term statistical analysis and trend evaluation.
Hourly historical irradiance data is not provided as part of Extended History datasets. Access to globally validated, site-specific hourly irradiance data is available through the SolarAnywhere Historical irradiance model via Typical Year, Typical Year+, or Sites licenses.
Extended History data is intended to complement, not replace, SolarAnywhere’s validated historical irradiance datasets.
Download Extended History Data Sample (CSV File)Downloading Extended History Datasets
- Choose a MeteoLens location from the Location List, and it will populate in the Download Ready Locations section.
- Select Download Options.
- In the download window, choose Extended History Data and specify the date range and datasets.
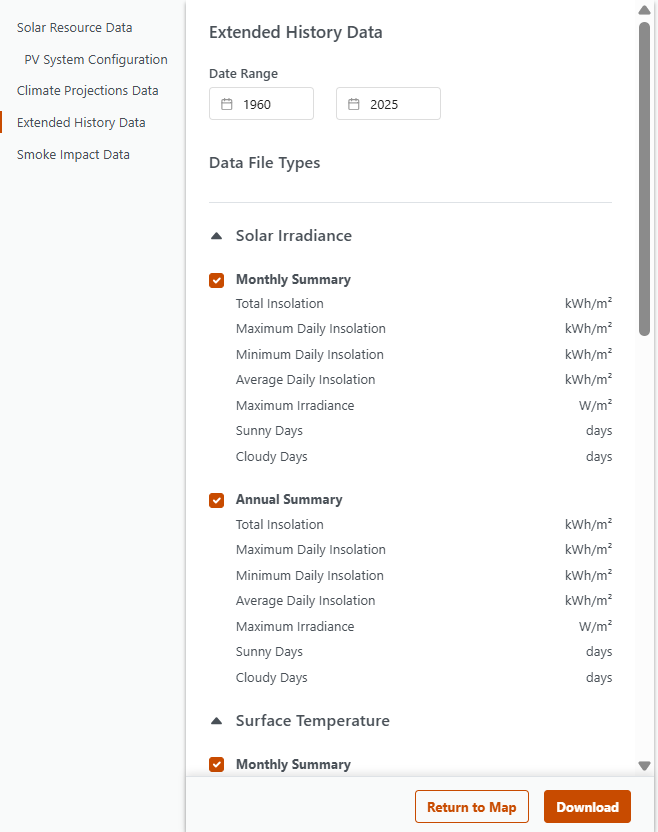
- Click Download and retrieve the data from the Files page.
References
1 Lee, J.-Y., J. Marotzke, G. Bala, L. Cao, S. Corti, J.P. Dunne, F. Engelbrecht, E. Fischer, J.C. Fyfe, C. Jones, A. Maycock, J. Mutemi, O. Ndiaye, S. Panickal, and T. Zhou, 2021: Future Global Climate: Scenario-Based Projections and Near-Term Information. In Climate Change 2021: The Physical Science Basis. Contribution of Working Group I to the Sixth Assessment Report of the Intergovernmental Panel on Climate Change [Masson-Delmotte, V., P. Zhai, A. Pirani, S.L. Connors, C. Péan, S. Berger, N. Caud, Y. Chen, L. Goldfarb, M.I. Gomis, M. Huang, K. Leitzell, E. Lonnoy, J.B.R. Matthews, T.K. Maycock, T. Waterfield, O. Yelekçi, R. Yu, and B. Zhou (eds.)]. Cambridge University Press, Cambridge, United Kingdom and New York, NY, USA, pp. 553–672, doi: 10.1017/9781009157896.006.
2 J. Huang, M. Perez and R. Perez, “Quantifying the effects of the 2023 Canada wildfires on surface solar irradiance,” 2025 IEEE 53rd Photovoltaic Specialists Conference (PVSC), Montreal, QC, Canada, 2025, pp. 0929-0931, doi: 10.1109/PVSC59419.2025.11132730.
3 P. Keelin et al., “Quantifying the solar impacts of wildfire smoke in western North America,” 2021 IEEE 48th Photovoltaic Specialists Conference (PVSC), Fort Lauderdale, FL, USA, 2021, pp. 1401-1404, doi: 10.1109/PVSC43889.2021.9518440.