

Several disasters disrupted the energy system. A cold air outbreak in February caused power outages for 10 million people across 15 states. ERCOT (Texas) experienced a major failure when frigid weather led to a spike in energy demand and shut down a large fraction of the state’s gas-fired generators, which were not designed for such extremes. In August, Hurricane Ida damaged all eight transmission lines serving New Orleans and left over 1 million people without power.
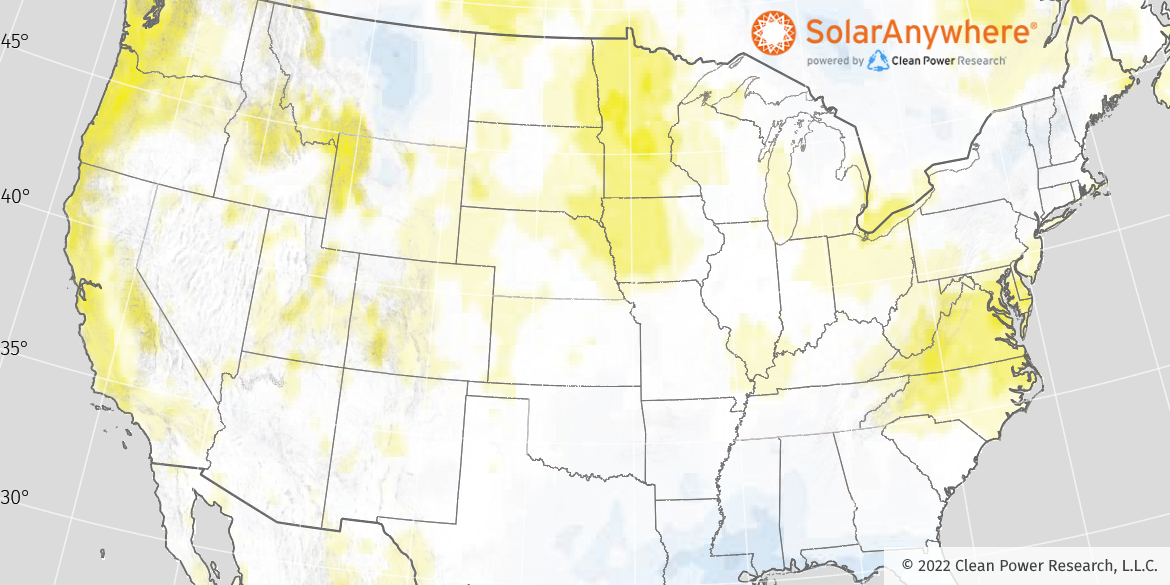
North America 2021 solar resource deviations
Despite the extreme weather, solar resource deviations in North America—based on SolarAnywhere® Data—were moderate in 2021, falling within +/-5% of long-term averages. As shown in the illustration below, the deviations in North America followed long-term observed trends in the solar resource. In particular, the Pacific Coast saw yet another sunny year. In this region, the 20-year change in mean annual GHI has been +5%. Virginia and North Carolina also had a sunny 2021, reinforcing similar long-term trends there. On the other hand, the Gulf Coast was cloudier than average, again. One must wonder if the downward trend in insolation in the region is related to the increased frequency of hurricanes and severe storms.

The American West continued to experience drought, record heat and wildfires. The 2021 wildfires were less severe than the year prior by most measures. Still, wildfires burned 7.1 million acres and caused $10.6 billion of damages. As highlighted in a recent webinar, smoke and ash from wildfires block sunlight and increase PV soiling. The wildfires reduced third-quarter 2021 insolation across the West (see the 2021 Q3 map, below), part of an alarming trend of such impacts.
High temperatures, which negatively impact solar production, were also factor in 2021. Across the U.S., temperatures were 2.5°F above the 20th-century average and ranked fourth warmest in the 127-year record.

The extreme weather and associated energy impacts experienced in 2021 highlight the increasing importance of resiliency and diversity in our energy infrastructure. The upside is that the clean energy revolution provides an opportunity to not only clean up our air, water and carbon emissions, but also to increase resilience with clean technologies such as solar, DERs and microgrids. Stakeholders that pay attention to the trends in weather and design systems for our future climate are likely to reap the benefits.

Learn More!
Watch the on-demand webinar: Quantifying Impacts and Risks of Wildfires and Extreme Weather with Improved Performance Benchmarking