
We’re introducing a major upgrade to our SolarAnywhere® solar deviation maps! The new maps expand coverage to three continents and increase resolution to ~50 km. The maps give asset managers and owners high-level insights into the weather trends affecting the production of their PV plants.
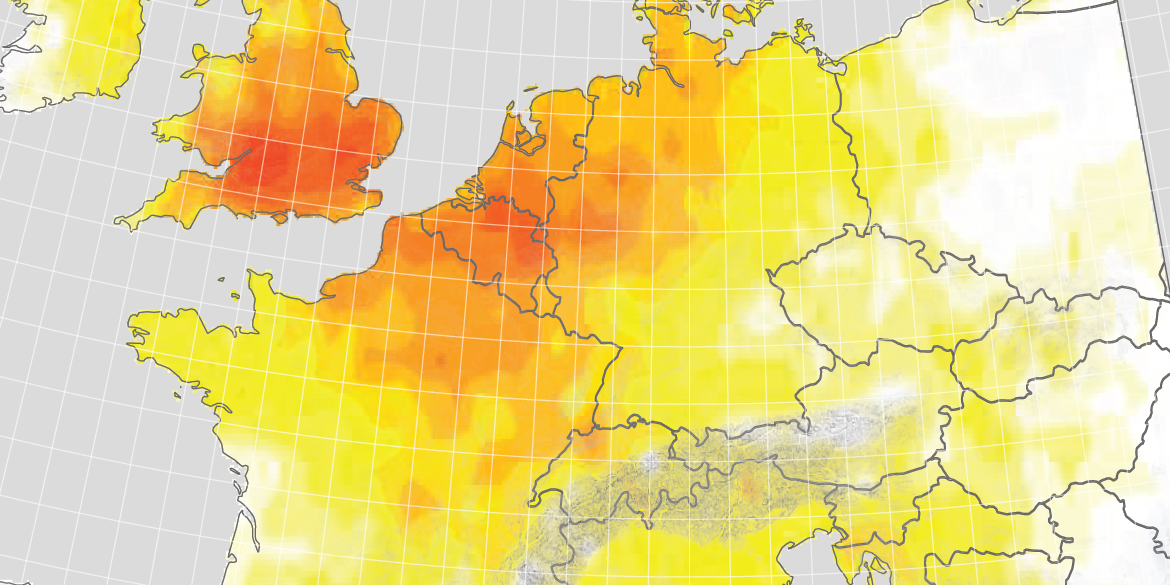
Below you can see maps for the first three quarters of 2020 for North America, South America and Europe. In the future, we plan to publish these maps to our blog quarterly. If you want to receive these maps, consider following us on LinkedIn or Twitter.
Solar weather report for Q1-Q3 2020
For the first three quarters of 2020, solar deviations were unremarkable in the U.S. and South America. Quarterly deviations generally fell within +/-10%, and year-to-date deviations (through September 2020) were even lower. The Midwest saw slightly positive deviations in Q2-Q3, breaking a streak of cloudy weather observed in 2018 and 2019.
In Europe, deviations of +10% to +20% were observed this spring (first and second quarters of 2020). These deviations were caused almost entirely by less cloud cover. Decreased aerosols due to COVID-19 lockdowns gave only a minor boost to GHI.
Climate disaster impacts on the solar industry
Climate disasters are on the rise: NOAA data for the U.S. shows 16 disasters exceeding $1B of damages through first nine months of 2020, tying the annual record. Disaster preparedness—understanding and mitigating losses due to wind, hail, and fire—is now a mainstream topic in the solar industry.
Record wildfires scorched the Western U.S., with plumes of smoke obscuring the sun and soiling panels. The EIA found that solar production in CAISO declined by 30% in the first two weeks of September from the July 2020 average. In South America, fires in Brazil’s Amazon are said to be the worst in a decade.
Smoke can negatively impact weather models and forecasts because smoke acts differently than other aerosols. The same is true with SolarAnywhere—the deviations shown in the maps below tend to underreport the reduction in sunlight due to smoke and haze. With wildfires increasing in the last two decades, more work is needed to better model the impact of smoke. Updates to SolarAnywhere enabling better modeling of solar plants impacted by wildfire smoke are already underway, with release tentatively planned for V3.5 in Spring 2021—stay tuned.
If you need real-time, site-specific solar data and intelligence so that you can improve reporting and decision-making for your fleet, consider licensing our services including SolarAnywhere® SystemCheck® and Sites.
Solar deviation maps


