


Sub-hourly data capabilities are increasingly essential as the solar industry faces tighter profit margins, larger-scale projects, and more complex system designs. With the approaching expiration of key federal tax credits—including the Investment Tax Credit (ITC) and Production Tax Credit (PTC)—project profitability is becoming more challenging. As a result, developers, operators and the lending community are under pressure to better estimate financial returns and maximize performance. Due to this, and as capital investment shifts toward larger PV projects with higher DC:AC ratios, the need for more accurate performance modeling—including precise estimation of clipping losses using 1-minute and 5-minute solar resource data—has become critical for project success.
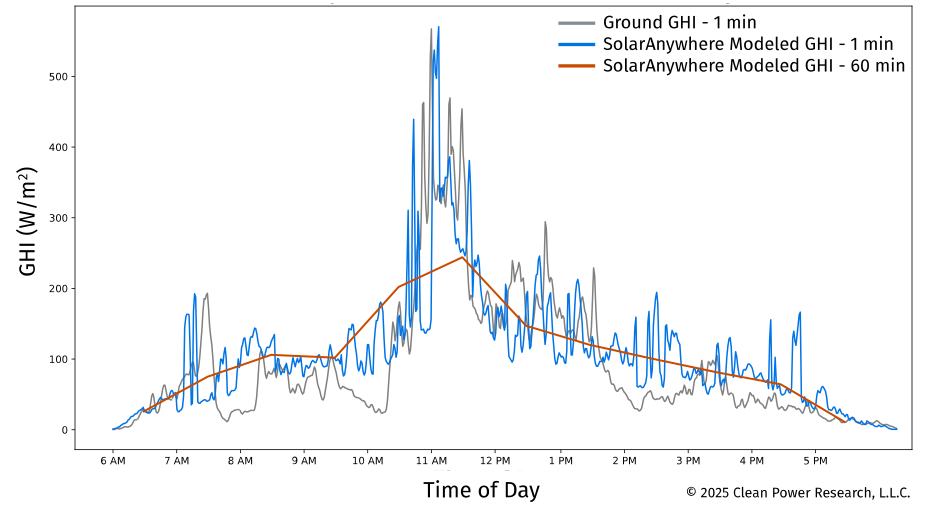
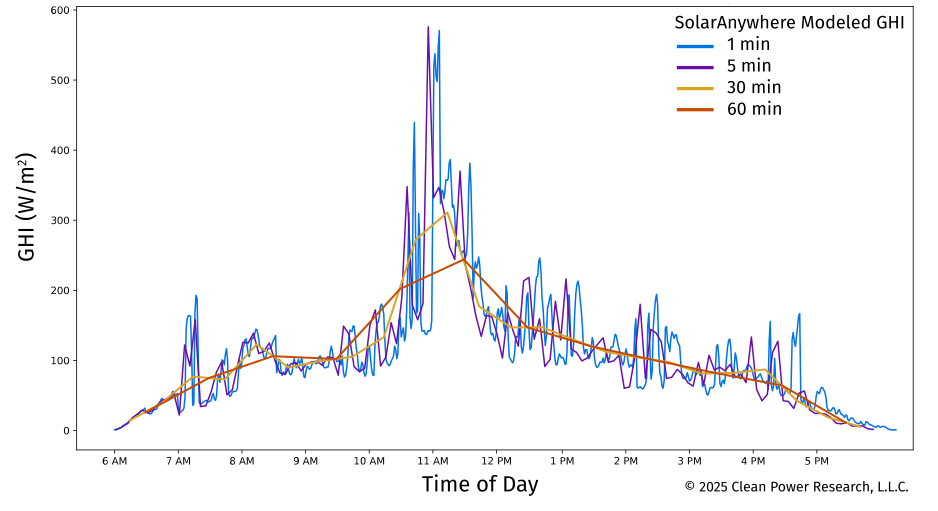
Figures 1 and 2 illustrate how SolarAnywhere sub-hourly datasets compare to ground-measured GHI and to each other at a single location over a 12-hour period. Figure 1 presents a time-series comparison of 1-minute modeled and observed GHI, showing how fine temporal resolution closely tracks real-world variability. Figure 2 builds on this by comparing modeled GHI at multiple resolutions (1-, 5-, 30-, and 60-minute), demonstrating that higher-resolution data more accurately captures short-term fluctuations that are smoothed out at coarser intervals.
- Synthetic variability that mimics real-world conditions – Our approach introduces intra-hour fluctuations that reflect patterns observed in trusted ground measurements.
- Preserved annual accuracy – Annual insolation totals for Global Horizontal Irradiance (GHI), Direct Normal Irradiance (DNI), and Diffuse Horizontal Irradiance (DHI) are preserved—often within a hundredth of a percent of the corresponding hourly values—ensuring consistency in annual yield assessments.
- Global coverage – Available for all regions between ±60° latitude, accessible via both UI and API for customers with eligible licenses.
- No price increase for existing customers – Existing Typical Year+ and Sites customers will receive access to these new high-resolution datasets at no additional cost.
Study spotlight: Why 1-minute data matters for accurate energy production estimation
To demonstrate the value of 1-minute resolution data generated from a statistical AI model, Jing Huang, Ph.D.—a member of the research team at Clean Power Research—conducted a study at a Seattle location. The study used one year of ground-based 1-minute irradiance data (2021) and one year of SolarAnywhere 1-minute typical year modeled data produced by our proprietary statistical downscaling approach. The study compared energy estimation accuracy based on GHI, assuming a fixed horizontal panel, and evaluated performance across different DC:AC ratios (i.e., Inverter Loading Ratios).
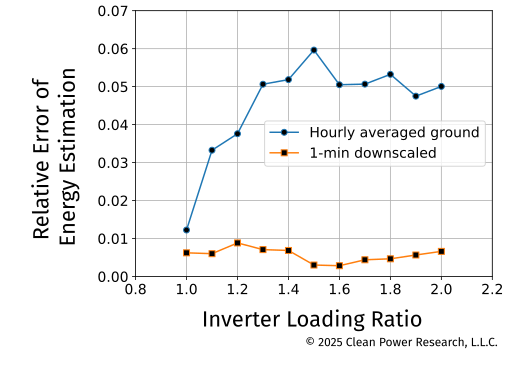
Figure 3 below shows that energy estimation relative error for hourly data grows with higher DC:AC ratios, while the SolarAnywhere 1-minute modeled data remains consistently more accurate and stable across DC:AC ratios. This demonstrates the clear advantage of using high-resolution 1-minute datasets for advanced PV modeling to capture clipping losses.
The enhanced statistical AI model goes beyond the original Gaussian copula statistical method, yielding more accurate representations of variability. Additionally, the model was trained on more than 250 years of high-quality, 1-minute ground data collected from stations across six continents (excluding Antarctica) and twelve Köppen-Geiger climate classifications, further improving its accuracy and global applicability.
Key findings include:
- 1-minute data delivers superior accuracy – Compared to hourly GHI values, the downscaled 1-minute data can reduce energy estimation error by 5–10%, down to approximately ±2% (a 50–100% reduction), depending on the location and climate type. The 1-minute modeled data maintains consistently low relative error across all DC:AC ratios, closely matching the “truth” established by 1-minute ground measurements.
- Hourly data underestimates clipping losses – When using hourly-averaged ground data, the relative error in energy estimation increases as the DC:AC ratio rises, peaking around a ratio of 1:6. This means hourly data fails to capture the short-term variability that drives real-world clipping events.
- Why this matters – As PV systems are increasingly designed with higher DC:AC ratios to optimize for profitability, accurately modeling clipping losses becomes critical for financial and operational decision-making. Our results show that only high-resolution (1-min) data can reliably capture these effects.
Data validation: Ensuring annual and intra-hour accuracy
High-resolution datasets are only valuable if they are proven accurate and reliable. To ensure SolarAnywhere 1-minute and 5-minute Typical Year (TGY/TDY) data meets this standard, Clean Power Research conducted rigorous validation of intra-hour variability in addition to the existing global validation for Data Version V4.0. Because these high-resolution datasets are derived from V4.0 and align at the hourly level, this additional variability validation confirms their accuracy at sub-hourly timescales. Together, these validations demonstrate intra-hour data bankability while maintaining the annual consistency established by V4.0.
This additional data variability validation spans 2019–2024, and uses ground data from a broad network of SURFRAD and SOLRAD stations across diverse geographic and climate regions. This comprehensive approach confirms that the model performs consistently under varying conditions worldwide.
How we validate accuracy:
- Ground truth benchmarking – Validation is performed at 1-minute resolution against trusted ground stations, including Class A pyranometric sites maintained to BSRN standards.
- Realistic intra-hour variability – We evaluate the Kolmogorov–Smirnov Index (KSI) and Variability Ratio to confirm that modeled ramp-rate variability closely matches ground observations.
- Variability Ratio: A perfect match equals 1.0; values near 1 indicate modeled variability mirrors real-world conditions.
- KSI: Lower values indicate stronger agreement between modeled and ground ramp-rate distributions.
- Robustness across climates and geographies – Validation covers multiple Köppen-Geiger climate classifications and geographical regions, ensuring global applicability.
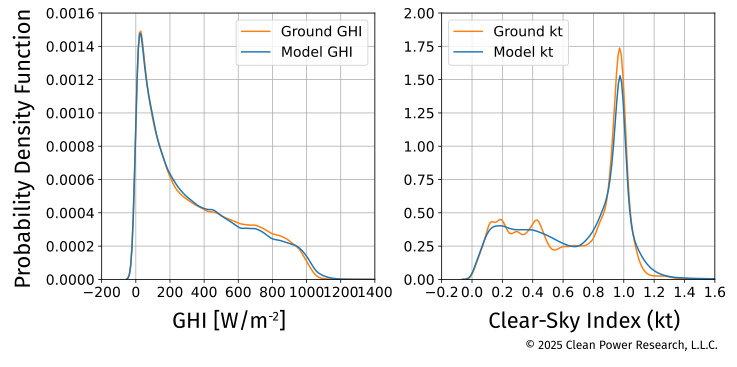
Figure 4 illustrates close alignment between SolarAnywhere 1-minute data and ground data at the Bondville SURFRAD location. Validation shows that across all stations and climate zones, SolarAnywhere 1-minute modeled data agrees strongly with ground truth. Variability ratios remain close to 1, and KSI values are low, confirming that the model accurately reproduces intra-hour variability. This means developers and engineers can trust these datasets for advanced PV modeling, clipping loss analysis and battery dispatch simulations.
Get started today
SolarAnywhere high-resolution 1-minute and 5-minute TGY/TDY datasets from Clean Power Research set a new standard for accuracy and realism in PV system modeling. By bridging the gap between hourly typical year data and real-world solar dynamics, these datasets empower developers, engineers and financiers to make better-informed decisions—especially when it comes to accurately modeling clipping losses and optimizing system performance.
If you don’t already have a SolarAnywhere account, sign up for free to access high-resolution Typical Year Data and all other SolarAnywhere Data features at select locations at no cost, or contact us to learn more.