

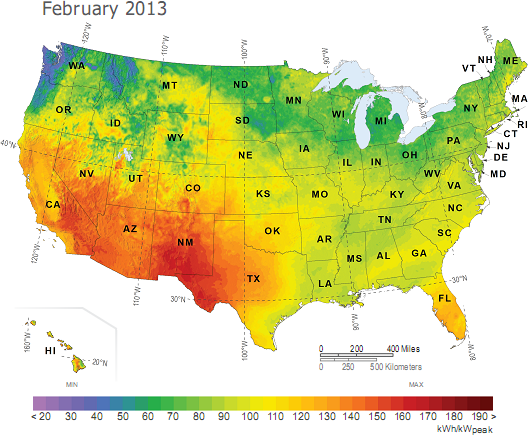
Intuitively, we know that solar power generation is dependent on seasonal weather conditions. The January and February PV Power Maps, published in the May/June 2013 issue of Solar Today, illustrate that this year was no exception, with month-to-month variability affecting most regions of the U.S.
In January, most of the eastern seaboard experienced above-average solar energy production. Florida’s sunnier-than-average conditions, in particular, led to unusually high PV power output. This turned around in February, when wetter-than-average conditions in the eastern United States resulted in a significant drop in power production.
Energy production around the Great Lakes region was suppressed during both months due to increased cloud cover, while the Southwest was near-to-above average for both January and February. Meanwhile, energy production jumped significantly in February in the lee of the Rockies in the Upper Midwest and the Great Basin region due to drier weather conditions.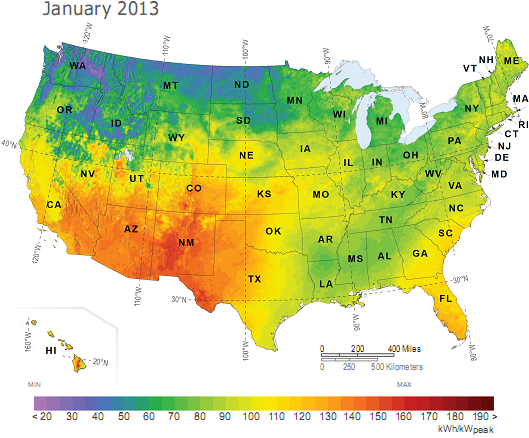
In general, with month-to-month energy production variability a given, how do PV system owners—whether residential, third-party, small commercial or utility-scale owners—put a value on their investment? Since production variability goes down significantly when looked at on an annual basis, the answer is to look at longer time-horizons to understand anticipated variability over the life of the PV system, which is typically 20 years or more.
The Solar Today PV Power Maps are created from power production data generated by Clean Power Research using SolarAnywhere® irradiance data and simulation services, and rendered by GeoModel Solar. The maps depict the amount of electricity that could have been generated by a nominal 1-kilowatt (kW) photovoltaic (PV) system on a monthly basis. You can learn more about the maps and how to use them in the article, ‘PV Power Maps: visualizing monthly production.’
The January and February maps are featured in the May/June 2013 issue of Solar Today (see page 6). PV Power Maps from September 2011 are available at the Solar Today blog, or in Resources on the Clean Power Research website.