

Have you ever wondered if PV system orientation really makes that much difference to the amount of power produced by a PV system? As the map below illustrates, the answer is typically yes, but to varying degrees.
This ‘Energy Gains’ map depicts how tilting solar panels 30 degrees, as compared to positioning panels horizontally, positively impacted the amount of energy produced across the U.S. in November 2012.
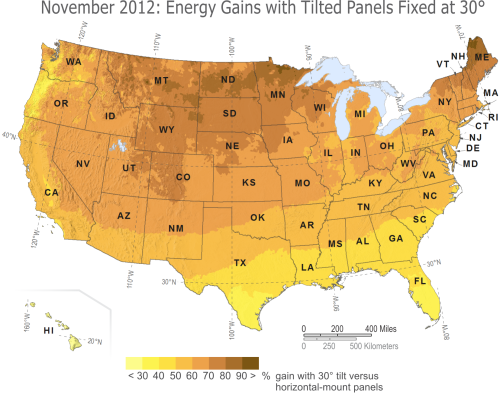
Tilt-mount PV systems generally have the greatest benefit in northern states, particularly during winter months, due to lower sun angles. That held true this past November when relatively sunny conditions in the upper Midwest and northeastern United States resulted in the highest gain in energy production with a tilt-mount system – as much as an 80-90% increase in some locations.
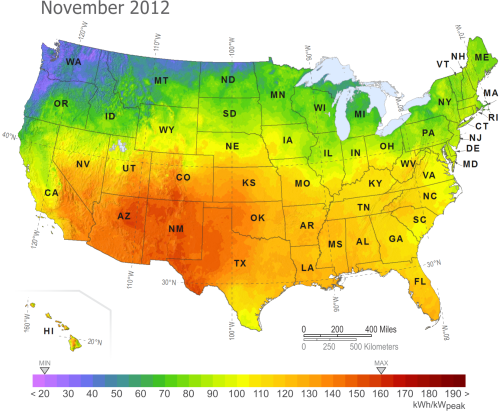
The ‘Energy Gains’ map is featured in the March 2013 issue of Solar Today (see page 8), along with the November 2012 PV Power Map, which shows the amount of electricity that could have been generated by a nominal 1-kilowatt (kW) photovoltaic (PV) system during that timeframe.
As the map below shows, PV energy production in November was above-average across the entire southern half of the United States as drought conditions in that region continued. Meanwhile, a series of Pacific storms caused PV energy production to dip across the Northwest.
The Solar Today PV Power Maps are created from power production data generated by Clean Power Research using SolarAnywhere® irradiance data and simulation services, and rendered by GeoModel Solar. You can learn more about the maps and how to use them in the article, ‘PV Power Maps: Visualizing monthly production.’ You can also access previously published maps online at Solar Today, or in the Clean Power Research resource library.