

The missing month
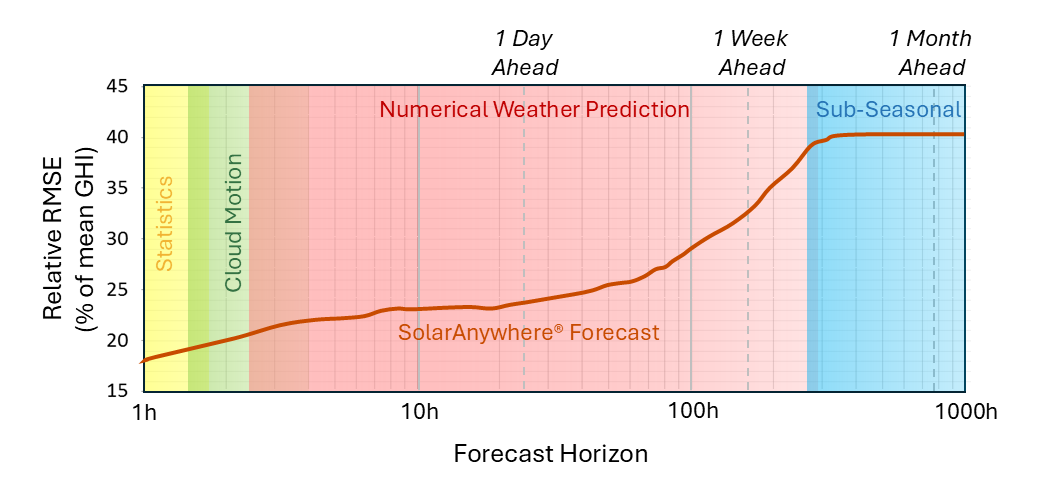
Solar forecasting has become remarkably good—provided the forecast is either for the immediate future or for the long term.
Modern numerical weather prediction (NWP) routinely delivers accurate forecasts over the coming days, albeit with declining skill as forecast horizon increases. Climatological averages, such as Typical Meteorological Year (TMY), characterize the long-term expected solar resource. However, between these horizons lies an operationally important gap of roughly two to eight weeks.
This “missing month” matters for PV asset management. It’s the timescale over which utilities schedule maintenance, traders establish forward positions, developers revise production estimates and asset owners manage commercial risk. Yet conventional weather forecasts lose skill before this horizon, while climatology cannot capture the evolving state of the atmosphere.
Better “missing month” forecasts mean lower risk
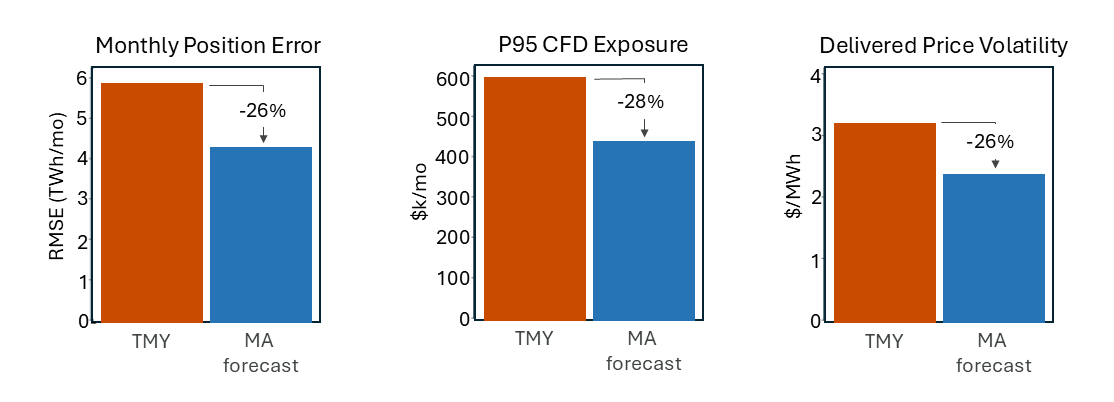
The value of improved month-ahead irradiance forecasts extends beyond forecast accuracy itself. Depending on market structure and contractual exposure, lower forecast error can reduce energy-position imbalances, contracts-for-difference settlement risk and volatility in realized electricity prices. More accurate forecasts, therefore, translate into more stable project revenues and more confident operational planning.
Developing new techniques to advance solar forecasting in this timeframe is an active area of investigation by the Clean Power Research® team. As renewable penetration increases, improvements of only a few percentage points in forecast accuracy can have meaningful financial consequences for PV plant owners and operators. In this article, we’ll explore one approach, and how it’s possible to reduce month-ahead forecast uncertainty—and lower risk—by factoring in climate variability, such as the effects produced by El Niño.
Climate has memory
Weather is inherently chaotic. Some components of the climate system, however, evolve much more slowly and therefore retain predictable structure over weeks to months.
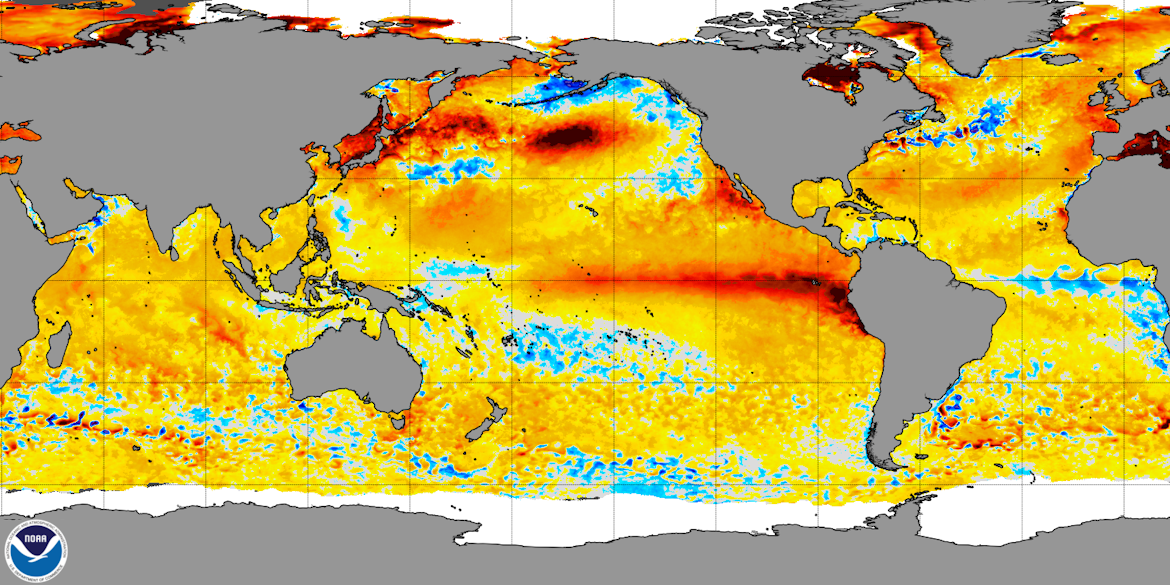
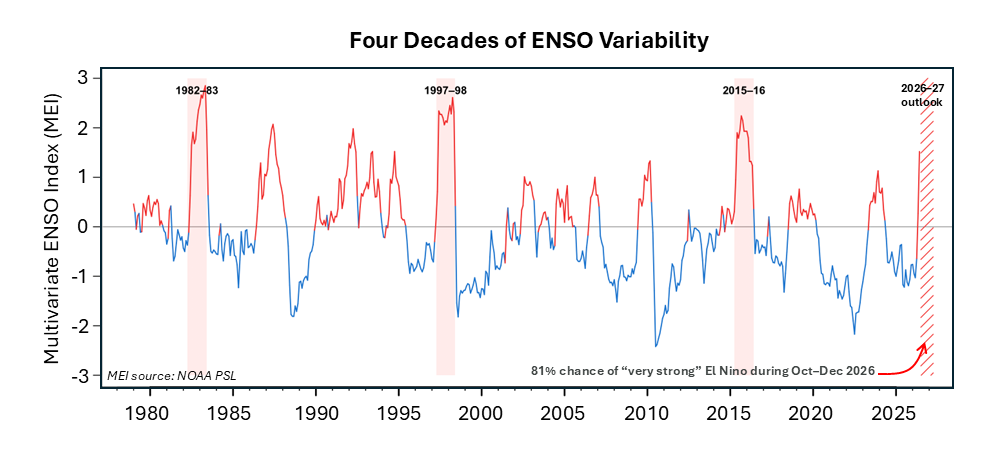
One of the strongest sources of climate variability is the El Niño–Southern Oscillation (ENSO), a coupled ocean–atmosphere phenomenon centered in the tropical Pacific. During El Niño and La Niña events, changes in sea-surface temperature reorganize atmospheric circulation, shifting cloud cover and precipitation patterns over much of the globe—including the western United States.
Unlike individual weather systems, ENSO evolves gradually over months. This slow evolution gives ENSO substantially greater predictability than day-to-day weather patterns, often extending several months into the future. As such, understanding what the ENSO is doing this month may be useful for anticipating the solar resource well beyond conventional NWP forecast horizons.
Climate signals arrive before the clouds
Detecting climate-scale relationships requires long, spatially consistent irradiance observations. SolarAnywhere® historical data span multiple decades providing the records needed to distinguish between persistent climate signals and ordinary year-to-year weather variability.
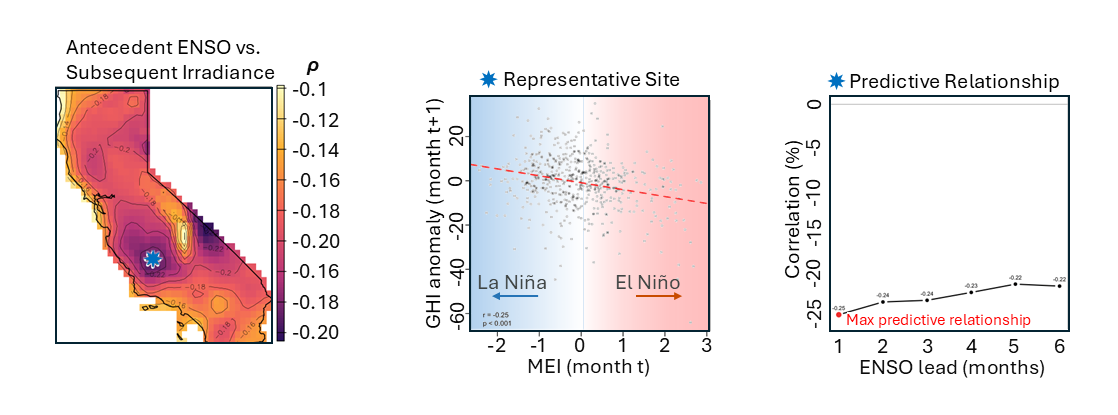
If ENSO influences cloud-producing atmospheric circulation, its present state should contain information about future solar resource. Across much of California, monthly irradiance anomalies exhibit statistically significant lagged relationships with antecedent ENSO conditions. The response is predominantly negative: positive MEI values (El Niño) tend to precede below-average irradiance, while negative MEI values (La Niña) tend to precede above-average irradiance. The strength of the relationship varies geographically, reflecting California’s complex topography and regional climate.
More importantly, the climate signal persists for several months, providing genuinely predictive information about the atmospheric conditions governing future cloudiness and solar irradiance.
From climate to forecasts
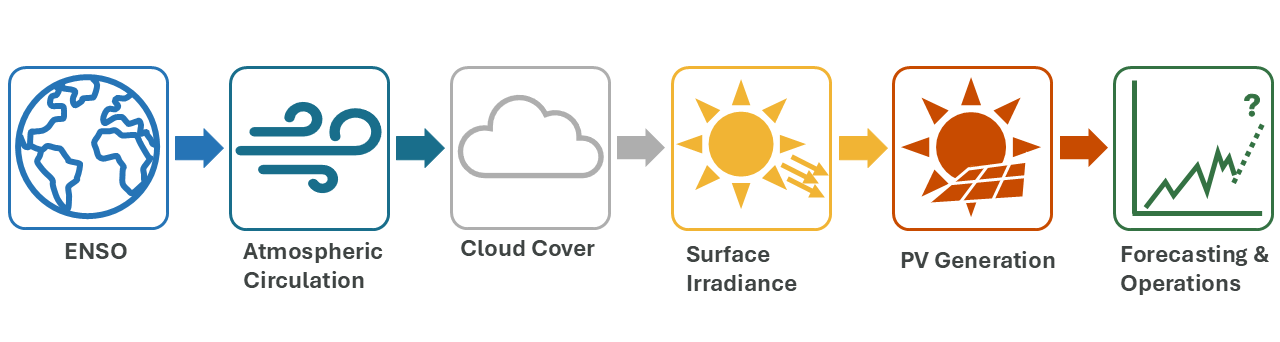
ENSO does not influence solar generation directly. It alters large-scale atmospheric circulation, which changes cloudiness, modifies surface irradiance, affects photovoltaic production, and ultimately changes operational and financial outcomes. Operational forecasting systems such as the European Centre for Medium-Range Weather Forecasts (ECMWF) and NOAA’s Global Forecast System (GFS) already represent many of these slowly evolving boundary conditions, including tropical Pacific sea-surface temperatures.
The opportunity is therefore not to replace numerical weather prediction, but to better exploit the climate information already present within it. This can be accomplished by combining it with extended historical irradiance records that reveal persistent relationships between climate state and solar resource.
SolarAnywhere is uniquely positioned to support this approach through its combination of operational NWP inputs and one of the industry’s longest, spatially consistent satellite-derived irradiance archives.
Other ENSO-like climatic events
ENSO is only one expression of the Earth’s climate system. Other slowly evolving modes of variability—including the Pacific Decadal Oscillation, Madden–Julian Oscillation and Indian Ocean Dipole—also influence cloudiness and solar resource over sub-seasonal timescales in specific regions of the world.
Together, these climate signals point toward a new generation of solar forecasting that bridges the gap between weather prediction and climatology.
Advancing month-ahead forecasting
Detecting climate-scale relationships requires both long records and geographically consistent solar measurements. SolarAnywhere’s historical irradiance data, spanning multiple decades, provides the statistical foundation needed to quantify these relationships and test their predictive value.
By combining physical weather models, satellite-derived irradiance observations and climate diagnostics, we’re investigating how large-scale climate modes—including ENSO—can enhance operational forecasting and extend SolarAnywhere forecasting skill into the sub-seasonal horizon.
The challenge is not only identifying climate signals, but translating them into reliable operational forecasts at asset scale, while preserving the spatial consistency and operational reliability our customers expect.
Bridging the “missing month” represents an opportunity to reduce uncertainty during some of the most commercially important planning horizons in the renewable energy industry.
Share your thoughts
Interested in month-ahead forecasting? Let our team know! Help us shape future SolarAnywhere products and features with your feedback.