
Sunlight is dynamic. Imagine sunlight filtering through broken, drifting clouds. Shadows and light race across the landscape. The sun tracks across the sky. This is the real world that solar systems operate in.
It’s no surprise that hourly PV modeling—still solar industry standard practice—leads to inaccuracies in energy estimation and system optimization. In 2012, for example, researchers at Sandia found that hourly-averaged simulations could overpredict annual output by as much as 2% .1 More recently, the overprediction of AC energy due to clipping losses has been estimated at 1.5-4% annually depending on system design and location.2 High DC:AC ratios, a recent trend for new installations, lead to errors at the high end of the range.
In addition, hourly simulations are inadequate for modeling the sub-hourly ramps of solar power. To maintain the stability of the electric grid with lots of solar, this variability must be managed. According to the U.S. Department of Energy’s Solar Energy Technologies Office, solar could grow from 3% of U.S. electricity supply in 2020, to as much as 40% by 2035. Solar developers increasingly need to design systems that cost-effectively deliver firm power—regardless of the weather.
A key challenge for the adoption of sub-hourly simulations has been the availability of site-specific solar data appropriate for sub-hourly modeling. We are making that challenge a thing of the past.
Introducing new SolarAnywhere high-resolution solar data with True Dynamics™
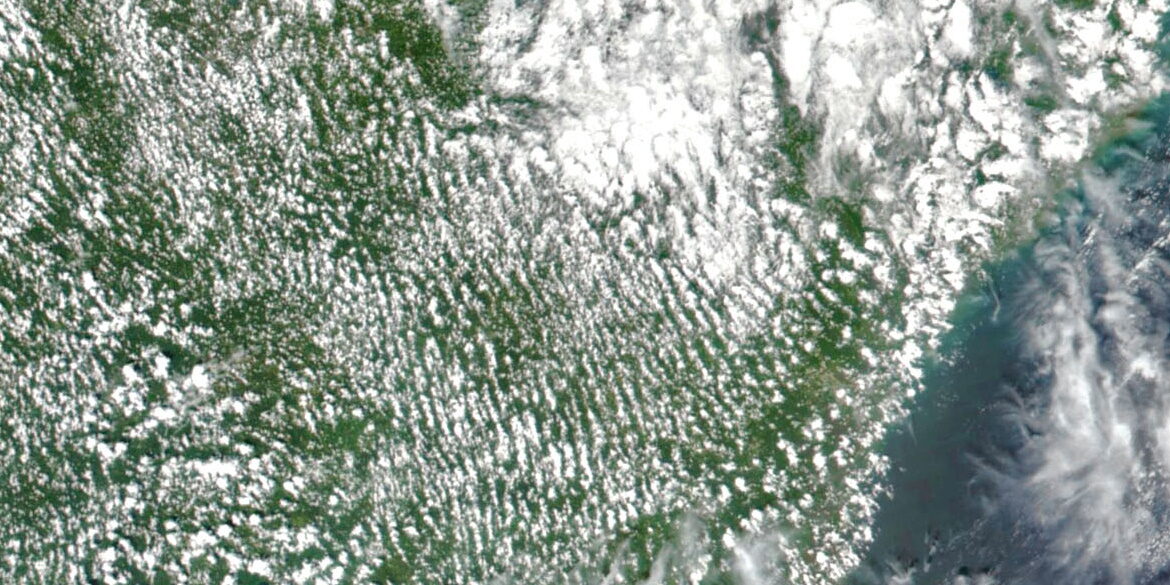
The latest generation of GOES satellites scan the continental United States at 24 times the resolution (6X temporal, 4X spatial) of previous generations. We’ve adapted SolarAnywhere to use the maximum-available resolution. As a result, users can now generate 2-plus years of solar data at 5-minute, 500-meter nominal native resolution on demand—a first for the solar industry. The full resolution GOES data input reveals the solar resource intermittency and is the best possible reference—i.e., source of truth—for sub-hourly solar models.
That’s only part of the story, however. To get the most accurate clipping loss and ramp rate simulations, the solar data must have realistic sub-hourly variabilities and power distributions. To address this, SolarAnywhere high-resolution data customers also have access to True Dynamics™, a unique methodology for preparing satellite images for sub-hourly analysis. With True Dynamics, SolarAnywhere high-resolution solar data is augmented with statistical techniques to behave more like ground-based measurements of real sunlight.
As demonstrated in Figure 1, the 5-min TD data captures large, intra-hourly ramp rates and clear-sky exceedance events due to cloud reflection that are not evident in hourly-averaged data. Consequently, using the new 5-min TD data generally leads to a more accurate estimation of AC energy.
Figure 1: Time-series Simulation Using SolarAnywhere Hourly and 5-minute TD, and 1-minute Observed Data

The development of True Dynamics
True Dynamics was developed in partnership with Dr. Richard Perez and stands on the shoulders of decades of solar variability research.3 Publication of the True Dynamics methodology and results is expected this year—please visit the support page for more information. While the research and methods will continue to evolve, True Dynamics means that users can be confident in using the data for sub-hourly simulations.
Improve modeling of hybrid solar energy resources with SolarAnywhere
Using SolarAnywhere High-resolution solar data with True Dynamics improves the accuracy of solar energy assessment. In internal testing, 5-minute simulations with True Dynamics data reduced clipping loss errors by more than 90% versus hourly data for high DC:AC scenarios (see Figure 2). As for assessing ramps and smoothing requirements, there’s no comparison.
Figure 2: Comparison of Estimated AC Clipping Losses Error

Estimated Losses Relative to 1-minute Observations for Hourly Averaged Observations, 5-minute Observations, SolarAnywhere Hourly, SolarAnywhere 5-minute, and SolarAnywhere 5-minute TD Data
Together with hindcast data to evaluate battery dispatch and firming strategies, SolarAnywhere users can get the next-generation solar data needed to confidently model today’s hybrid solar energy resources. Better modeling allows for more optimal project designs and tighter design margins, reducing the CAPEX needed to meet project requirements.
Interested users are invited to test the new data options at no cost at any of the High-resolution Public Sites by visiting data.solaranywhere.com. Or contact us for more information.
References
1 Hansen C W, Stein J S, Riley D, 2012. Effect of Time Scale on Analysis of PV System Performance. Sandia National Laboratories, Report number: SAND2012-1099. DOI:10.13140/2.1.1150.3368. Link
2 Bradford K, Walker R, Moon D, Ibanez M, 2020. A Regression Model to Correct for Intra-Hourly Irradiance Variability Bias in Solar Energy Models. 2020 47th IEEE Photovoltaic Specialists Conference (PVSC), June 15-August 21, 2021. DOI: 10.1109/PVSC45281.2020.9300613. Link
3 Perez R, David M, Hoff T, Jamaly M, Kivalov S, Kleissl J, Lauret P, Perez M, 2016. Spatial and Temporal Variability of Solar Energy. Foundations and Trends® in Renewable Energy, Volume 1, Number 1: 1-44. doi.org/10.1561/2700000006. Link