

While the average power purchase agreement (PPA) price falls to keep solar competitive, the amount of global solar capacity developed in the past two-years has increased at a rate of roughly 30% year-over-year. This means that project developers are being forced to look for more efficient approaches to get their projects to market.
Given this emerging competitiveness, solar project developers have a few options. They can accept decreased net cash flow or operating margin, or reinvest in R&D to offer a more valuable product to the market. One example of the latter is solar plus dispatchable storage for generation firming and ancillary services, a topic we recently wrote about. Another approach is to improve solar project bankability with more efficient project financing.
Bankability of financeable projects in this evolving market is still an attainable goal. Based on input from our customers using SolarAnywhere® to finance projects, we’ve identified The Five Factors of Bankability. These factors include:
- Validated and widely accepted data
- Known and acceptable uncertainty rates
- Long history and current data
- Spatially precise
- Built for solar applications
All five factors are important considerations for solar irradiance data for project finance, and you can read more in-depth case studies of specific factors, including:
- SolarAnywhere Data Validation – addresses Factors 1 and Factor 2
- Version control: Your bankable signpost in a digital world – addresses Factor 2
- How Misuse of Solar Resource Datasets is Reducing Solar Industry Profits – addresses Factors 4 and 5
In this post, however, we’ll specifically highlight Factor 3—long history and data currency—and how it applies to maintaining project bankability in the increasingly competitive market.
Detailing the third factor of bankable solar resource data
The third factor of bankable solar resource data is whether the data source has both a long history and is kept up to date. The reason this is important is explored in a recent joint paper published by Clean Power Research and SunPower. The authors outlined two ways in which a long history of data impacts accuracy, and thus, solar project bankability, including:
- Reducing the uncertainty of the long-term average solar resource, also known as the period of record uncertainty.
- Accurately estimating the likelihood of low insolation years (i.e., 99th percentile probability of exceedance or P99), and thereby appropriately managing production and financing risk.
Let’s explore each of these business impacts.
Impacts of long history on annual solar insolation uncertainty
A long history of solar resource measurements is important to solar project bankability because it impacts data uncertainty. If your solar data only uses a few years to compute a P50 (or typical year) value, the potential error in your value will be greater. As shown in this case study (Figure 1), fewer years of data used in calculating the average (or “mu”) results in a wider confidence band and higher period of record uncertainty.
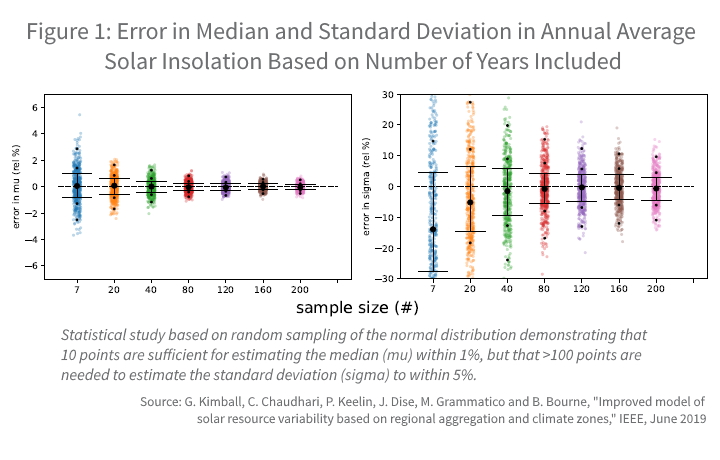
What does this mean for project financing? When creating a bankable solar resource dataset, you want to leverage as many years of data as possible. For satellite-based measurements, this means gathering data as far back as 1998.
Impacts of long-history on production risk
It’s a best practice to calculate downside risk by incorporating a long period of solar resource data to produce different probabilities of exceedance (PXX). This application of solar data is the most sensitive to using a long history of data, to the point where I want to issue a disclaimer for all project developers, financiers and independent engineers:
If you’re using a solar resource dataset with less than 15-years of measurement, DO NOT (I repeat DO NOT) use this dataset for calculation of debt service coverage via probability of exceedance (PXX).
This is important because we’ve seen an underestimation of the interannual variability when only a few years of data is considered for a solar resource dataset. This underestimation can put your project in severe production risk and impact debt payback and cashflow. This is highlighted in the following case study (Figure 2), where the study on the left used between 7-12 years of satellite resource data versus >20 years in the figure on the right.
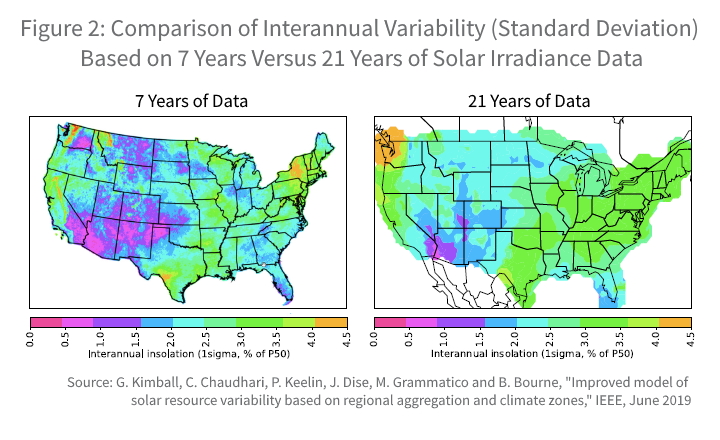
As you can see, the left figure understimates the interannual variability of the solar resource because of the limited number of years considered.
SolarAnywhere providing solar project bankability with long-history solar data
As project development now moves to a new phase of competition in the market, the efficiency of capital will become more and more important. Risks associated with using free, incomplete or unproven datasets will impact your company’s ability to survive in this new market.
SolarAnywhere is here, and we’ll continue to deliver bankable solar resource data with as long a period of record available in the satellite model. Contact us to learn more.