

The challenge is well-known by commercial building owners and PV project developers: on site solar PV generation offers excellent energy savings to commercial customers, but can result in unreliable demand charge reduction benefits. Through a recent DOE funded demonstration project, Clean Power Research and EdgePower demonstrated how use of commercial building-level solar forecasts can intelligently shift electric loads and reduce utility demand charges.
What is a demand charge and why does it matter?
Utility demand charges are applied to commercial and industrial customers based on the peak amount of energy used during 15-minute periods. Demand charges are typically aligned with the utility’s cost to serve large energy consumers and can account for a significant portion of the customer’s total bill. This encourages large energy users to smooth their energy needs and reduce big spikes in demand for electricity.
For a commercial building with PV, reducing peak usage is important because the expected savings in reduced electricity consumption from the utility can be offset by higher demand charges if variable PV energy production is not properly managed. An earlier post described the motivation for this project and illustrated this point.
For further illustration, say you have Company A, which uses 1,000 kWh of electricity a month at $0.09 a kWh. Their largest demand for power is 50 kW, and the demand charge is $1.00 a kW. Company A decides to install a PV array that will reduce their energy consumption by 30%, to 700 kWh a month. However, the PV array will not necessarily reduce their demand charge. This means that Company A may not see the savings they expect because even though they are using 30% less energy, their demand charges have not been reduced. The table below breaks out the example bills with and without PV production for Company A where the final bill savings is only 20% due to no reduction in demand charges.
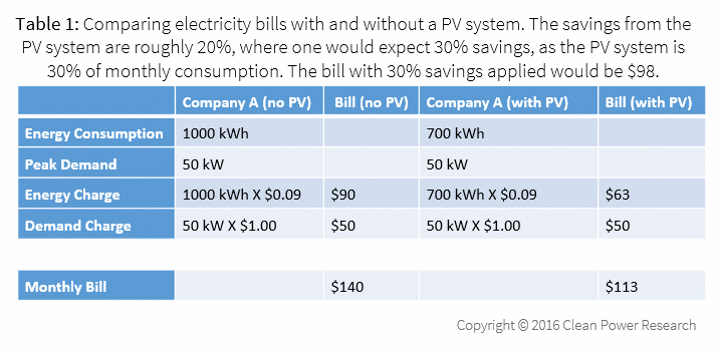
You can find further in-depth examples of demand charge incursion here.
How solar forecasting technology can be used to reduce demand charges
Given the inconsistent savings from energy charges alone, commercial customers with PV systems are looking for ways to reduce demand charges. Clean Power Research combined their solar PV forecasting software with the building load management technology of EdgePower to reduce demand charges.
The demonstration site had a 100-kW PV system. The automated building energy system controls from EdgePower ingested forecasts of PV power output from Clean Power Research, then proactively adjusted building energy use, targeting periods with reduced PV production and high building load and using strategies that shifted building energy use to adjacent time periods, where either: a) building load was lower, or b) PV production was higher. The end goal being an overall reduction in the customer’s electricity bill, consistently achieved over multiple billing periods.
Targeted solar forecasting improvements
To support this use case, Clean Power Research applied changes to the solar forecasts, which were originally designed for forecasting utility-scale PV plants. Utility-scale PV plants typically have significantly larger plant footprints and use hourly resolution forecasts. Demand charges, however, are usually based on 15-minute time periods, so for a forecast to be useful it needs to be informative at a 15-minute resolution. Hourly forecasts interpolated down to 15-minute resolution were not shown to be effective in imparting any 15-minute resolution forecast variability because interpolation assumes no change in the cloud cover.
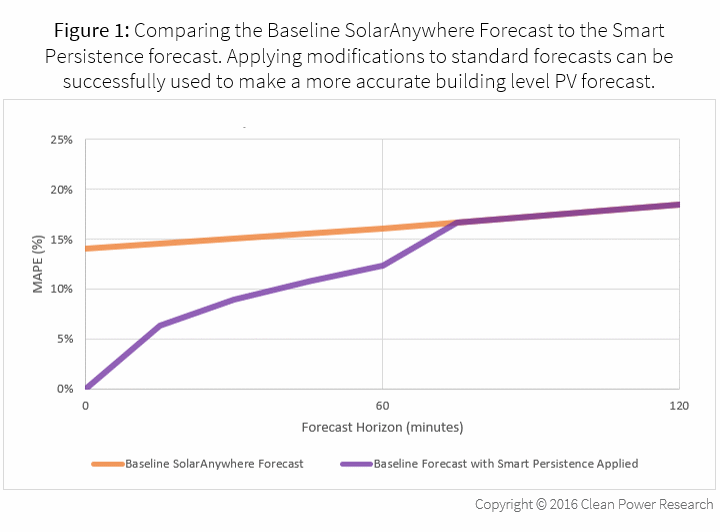
To integrate with these forecast changes to the commercial building site, EdgePower managed real-time collection and communication of the metered PV output at the test site. They fed this information back into Clean Power Research’s solar forecasting system where a “smart persistence” blending technique was used. This technique is based on a forecast model that reads the meter data in real time and uses real-time PV power observations to augment the forecast, having the greatest impact in the near future. It is exciting that this technology is applicable to any PV system that can communicate its real-time power output back into the forecast software.
Figure 1 (below) shows the improvements of new modified forecast over the baseline solar forecast. Mean Absolute Percentage Error or (MAPE), is the Mean Absolute Error normalized by average site power output, and is a good way to measure forecast error as a function of forecast horizon.
Results
During the project demonstration period, there were 26 control periods during which EdgePower’s Solar-Integrated Load Control controlled the building to reduce load. The solar forecast-driven load control reduced load by up to 25kW on a building that typically has a maximum load of 100kW. This load reduction was achieved without sacrificing occupant comfort. This project successfully demonstrated load and demand charge reduction on multiple days during the project demonstration period.
Conclusion
Through the combination of solar PV forecasts and adaptive building load control, the building is used as a “battery” at a much lower cost to implement than installation of traditional chemical batteries. There is the potential to retrofit this technology to buildings with PV plants to help realize additional savings, but it could also be included with new PV projects where the host customer is also considering chemical batteries. The application of solar forecasting and building load control could reduce the size (and cost) of a battery system and thus open the number of buildings where solar PV plus storage combinations are economically viable.