
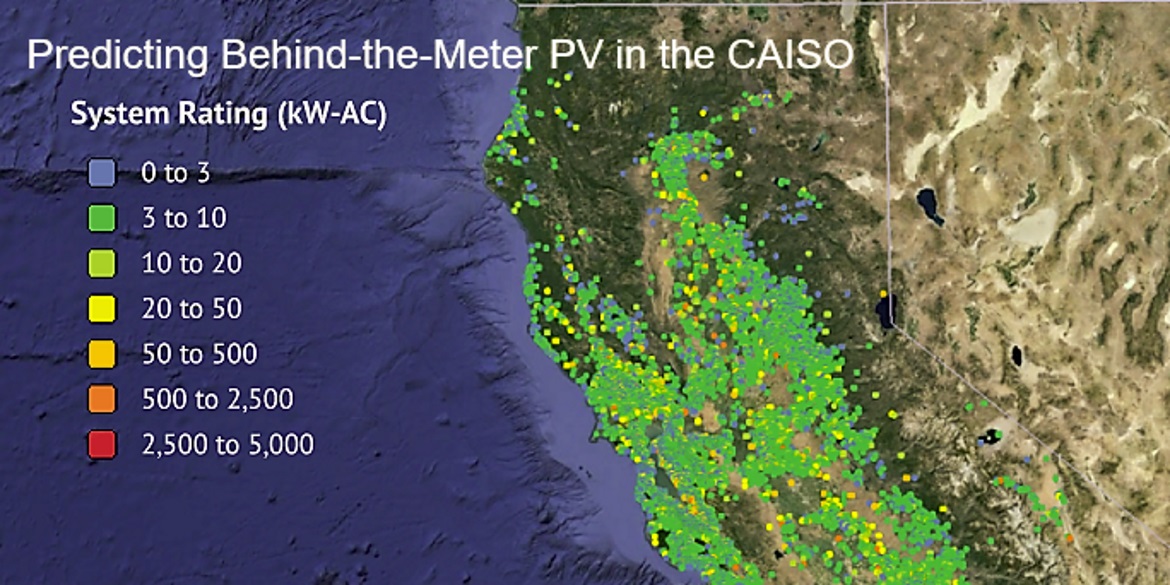
In recent years, Clean Power Research created a solar forecast method to accurately predict power production of “invisible,” behind-the-meter PV systems—typically those found on homes and commercial buildings. In our approach, forecasts are generated by simulating the power output of an individual system based on its defined specification and the predicted solar radiation at its specific location, and then aggregating the power output of all the systems within a particular service territory.
This methodology is now being used to forecast the total production of all behind-the-meter PV systems in the California Independent System Operator (CAISO) territory. As part of its ongoing research funded by a SUNRISE award from the Department of Energy (SUNRISE stands for Sustainable Utility Network Repeatable Innovations in Solar Energy), Clean Power Research began feeding the behind-the-meter prediction into the load forecasting tools used by the CAISO. The result: with the right model training, prediction of behind-the-meter PV production makes utility load forecasts better.
As the U.S. leader in installed behind-the-meter PV capacity, the State of California is an ideal proving ground for new PV forecasting technologies. Adding behind-the-meter PV predictions from SolarAnywhere® FleetView® into load forecast models will allow utilities and grid operators across the country to stay ahead of growing PV, while maintaining grid reliability and managing the cost of imbalance.
Prediction of behind-the-meter PV production makes utility load forecasts better
Utilities and balancing areas are responsible for balancing generation and load (utility terms for “supply” and “demand”) on their grids. As has been documented by the CAISO, a dynamic change in the load shape is being observed. This change is largely believed to be caused by behind-the-meter PV.
Buildings with PV typically consume less energy from the grid. When enough PV systems are installed, the reduction in demand for energy from the grid can impact overall load forecasts. Loss of forecast accuracy can result in short-term market exposure and raise costs to market participants.
Load forecasting models use learning techniques that find correlations between forecasted input variables (such as air temperature) and measured values (such as metered system demand or load), but have (until now) largely run independently of any behind-the-meter PV predictions. As a result, actual PV production can lead to a load forecast that over-predicts or under-predicts load requirements during daylight hours.
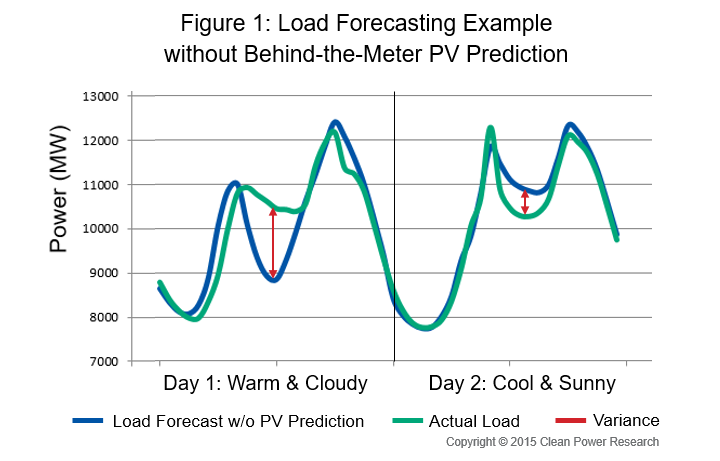
One example of this occurs when air temperature is used by load models to predict electric loads on subsequent days. In the example shown in Figure 1, cloud cover is thicker and temperatures are higher on the first day, leading to higher loads from the increased use of air conditioning.
On day two, however, the temperature is more moderate, and is coupled with clearer sky conditions. This leads to higher PV production, but lower loads due to less use of air conditioning. As a result, the day two load forecast—which is based, in part, on the previous day’s forecast—is incorrectly predicted to be higher than actual.
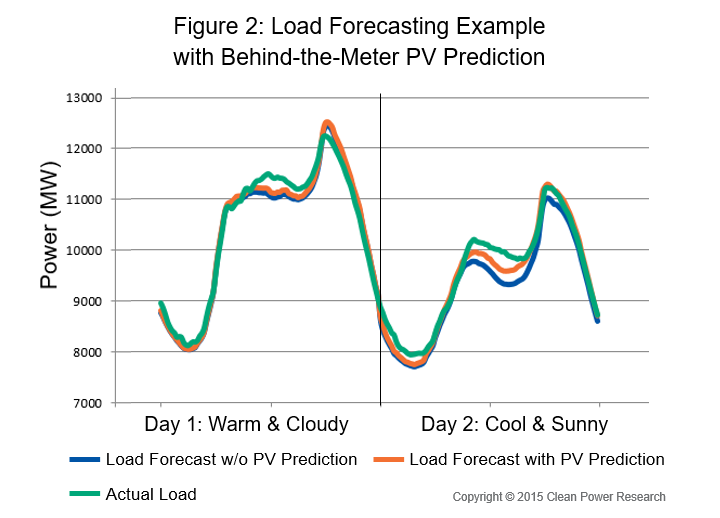
After seeing this phenomenon occur within the load prediction models, we began testing the impact of integrating behind-the-meter PV forecasts from FleetView. For these tests, the load forecast model was executed in two configurations: with and without the behind-the-meter PV forecast.
The conclusion: use of the behind-the-meter PV forecasts better accounts for behind-the-meter PV generation within the load forecast on both cloudy and sunny days. This is shown in Figure 2, where the forecasted load with PV prediction more closely matches the actual load.
Accurate load model training is necessary
As our research unfolded, we realized that in order to impact the load forecast with behind-the-meter PV forecasts, a first step was to train the existing load model to recognize the PV “signal.”
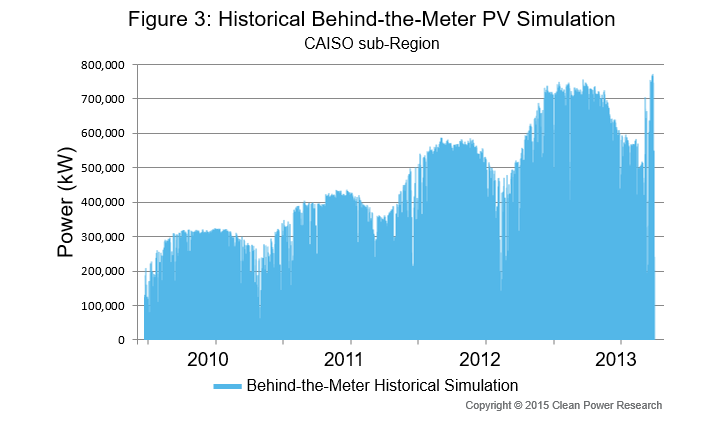
Predicting the ongoing output of PV involves the use of forecast models operated in real-time to deliver data into operational tools for the grid operator. A historical simulation, however, strives to predict what impact the behind-the-meter PV would have had on the load over a recent period (i.e. January 2012 to December 2015). This historical simulation, we found, was key to the improvement in the load forecast model, and how it would consume the forecast operationally.
To test the strength of the load model improvement, we measured how much the load model reacted to each incremental unit of behind-the-meter PV output. In Figure 3, we present the historical simulation used for one sub-region of the CAISO. This graph exhibits a number of features, including rapid growth in PV over the time period, and variation in the summer months based on actual cloud conditions from those years.
With the growth of behind-the-meter PV capacity, new solutions are needed to keep the electric grid operating efficiently. Department of Energy SUNRISE funding has given Clean Power Research a great opportunity to verify that behind-the-meter PV predictions will result in better load forecasting, and learn more about how to best integrate these forecasts into the operations of electric utilities and grid operators.
With the state of California as our test-bed, Clean Power Research demonstrated how FleetView makes it possible for load forecasters and grid operators to, for the first time, measure the impact of these “invisible” PV systems in day-to-day operations. Project results prove that FleetView’s output can keep existing operational tools from failing under the changing energy landscape, and reduce losses due to short-term market exposure that result from inaccurate load forecasts.